
Lab 1 – Nutrition Assessment
44
Nutrient as agent
1. according to type :
a- under nutrition (quantity) starvation
b- Mal nutrition (quality) protein, vitamins.
c- over nutrition (quantity) 0besity.
d- Food allergy.
2. according to relation to immune mechanism
a- lower natural resistance (vitamin A Deficiency change
in mucous membrane).
b- Interfere with antibody productions.
c- Increases in severity of diseases (vit C).
To assess nutritional condition we need:
A combination of
1. Clinical examination and
2. Epidemiological facts
3. Anthropometric Data
4. Biochemical testing is used to assess. Micronutrient
deficiency diseases.
The Nutrition Care Process:
Identifying and meeting a person’s nutrient and nutrition
education needs. Five steps:
1) Assess Assessment of nutritional status
2) Analyze Analyze assessment data to determine nutrient
requirements
3) Develop Develop a nutrition care plan to meet patient’s
nutrient and education needs.
4) Implement: Implement care plan
5) Evaluate: Evaluate effectiveness of care plan: ongoing
follow-up, reassessment, and modification of care plan.
Assessing Nutritional Status
•Historical Information
•Physical Examination
•Anthropometric Data
•Laboratory Analyses
A- Historical Information:
Health History (medical history) - current and past health
status
–diseases/ risk factors for disease
–appetite/food intake–conditions affecting digestion,
absorption, utilization, & excretion of nutrients–emotional
and mental health
Drug History
– Prescription.
– illicit drugs
–nutrient supplements, HERBS and other “alternative” or
homeopathic substances
– Multiple meds (who’s at risk?)
Meds can alter intake, absorption, metabolism, etc.
Foods can alter absorption, metabolism, & excretion of
meds.
Socioeconomic History
Factors that affect one’s ability to purchase, prepare, &
store food, as well as factors that affect food choices
themselves.
–Food availability (know local crops/produce)
–occupation/income/education level
–ethnicity/religious affiliations
–kitchen facilities
–transportation
–personal mobility (ability to ambulate)
–number of people in the household
Diet History
Analyzing eating habits, food intake, lifestyle, so that you
can set individualized, attainable goals.
–Amount of food taken in
–Adequacy of intake – omission of foods/food groups
–Frequency of eating out
–IV fluids
–Appetite
–Restrictive/fad diets
–Variety of foods
–Supplements (overlaps)
B- Physical Examination:
-weight status
-mobility
-confusion
-signs of nutrient deficiencies/malnutrition
esp. hair, skin, GI tract including mouth and tongue
-Fluid Balance (dehydration/fluid retention).
Limitations of Physical Findings
–Depends on assessor!
–Many physical signs are nonspecific: ie. cracked lips
from sun/windburn vs. from malnutrition, dehydration…
Lab 1 – Nutrition Assessment
45
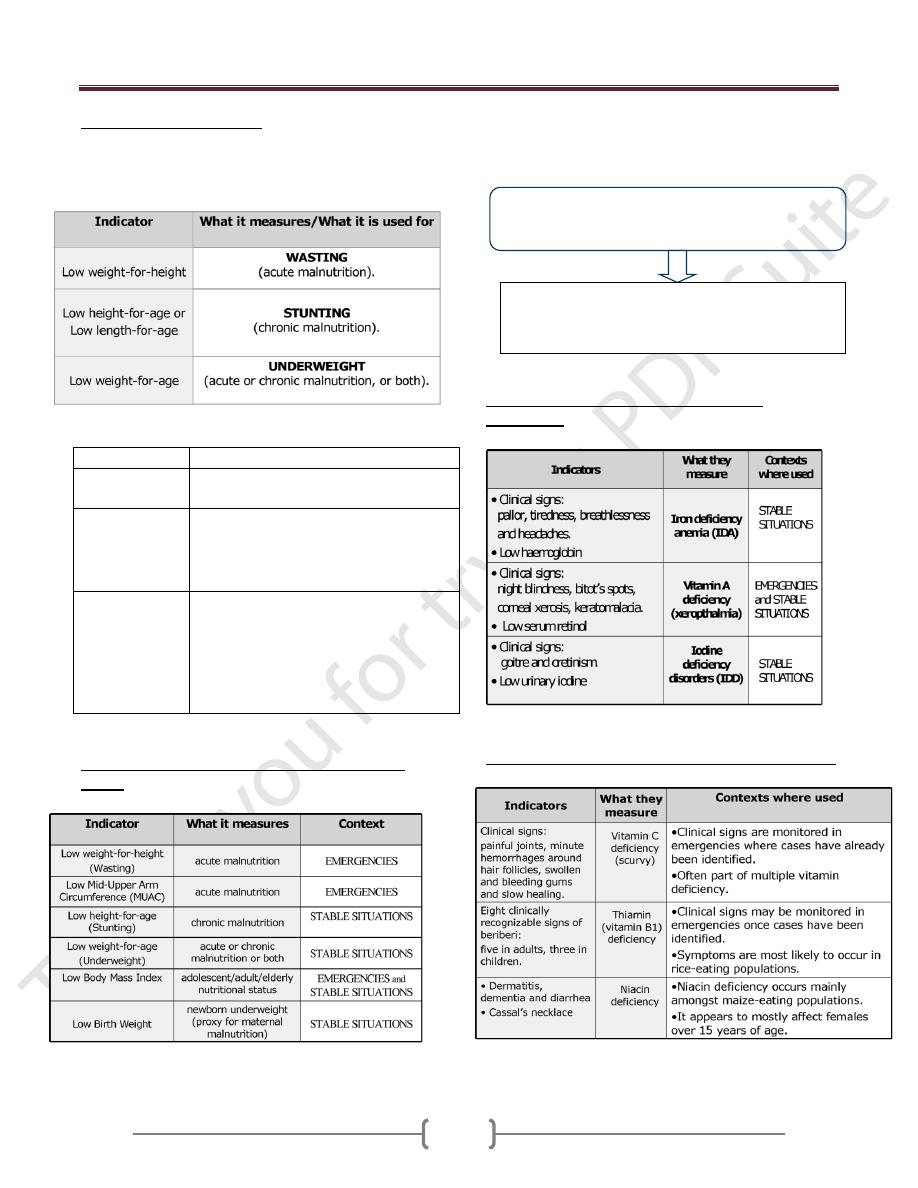
Nutritional status indicators
There are three primary anthropometric indices for
children under five years of age: Wasting; Stunting, and
Underweight.
Index/indicator What it measures/what it is used for
Body Mass Index
(BMI)
It measures thinness in adolescents, adults
& the elderly.
Low Birth
Weight (LBW)
It measure newborn weight.
It associated with poor nutrition in
mothers (although other factors can also
contribute to low birth weight.
Mid-Upper Arm
Circumference
(MUAC)
It is an index of body mass.
It is usually measured using a MUAC
that is placed around the middle of the
upper arm
It is particularly good for identifying
with high risk of mortality
Contexts in which these indicators are particularly
useful:
A combination of clinical examination and biochemical
testing is used to assess micronutrient deficiency diseases.
Indicators used for assessing micronutrient
deficiencies:
Other micronutrient deficiencies & relevant indicators
Biochemical testing is carried out on blood or
urine samples.
It is vital in situations where there is a strong
indication of risk of micronutrient deficiency but a
lack of clinical evidence.

Lab 1 – Nutrition Assessment
46
Key indicators for rapid assessment:
Mortality rates and causes of mortality
Demographic profile
Morbidity data on the most common diseases
Presence of diseases with epidemic potential
Data on immunization and vaccine coverage
Coverage of vitamin A supplementation
Predominant infant and young child feeding practices
C- What are the anthropometric
measurements & how are they used in
nutritional assessment?
Anthropometric measurements include height, weight,
skin fold thickness and circumference measurements of
different parts of the body. These measurements reflect
present nutritional status and can be used to estimate the
degree of obesity and even the percentage of body fat.
Three commonly used anthropometric indices are derived
by comparing height and weight measurements with
reference curves:
1- Height for age
2- Weight for age
3- Weight for height
Height for Age:
Length: refers to the measurement in a recumbent position
used in children aged less than 2 years who cannot stand
well.
Standing height: refers to as stature so height is used to
cover both measurements:
a) Low height for age (shortness): either normal variation or
pathological process.
Stunting: gaining insufficient height relative to age.
The term chronic malnutrition is used to describe low
height for age.
b) High height for age: (tallness) is an indicator with little
public health significance.
Weight for height:
Reflects body wt. relative to height
a) Low weight for height (thinness and wasting), thinness
does not necessary imply a pathological process.
Wasting: refers to recent and sever process that led to
significant weight loss, usually as a consequence of acute
starvation and \ or sever disease.
b) High weight for height :over wt. and obesity
What is the Body Mass Index (BMI)?
The BMI is commonly used to estimate the level of
adiposity in individuals or in groups It defines as a
relationship of weight to height, so is defined as a ratio of
weight to the square of height:
BMI = Weight in kg \ (height in meter) 2
Table cut- offs for BMI in adults:
BMI
Weight status
Risk of co-
morbidities
Below 18.5
under wt
low
18.5-24.5
normal
average
25.5-29.9
over wt.
increased
30.0-39.9
obese
moderate- sever
Above 40
very obese
sever
Weight for age:
a) Low weight for age: (lightness): is a descriptive term for
low wt. for age.
(Underweight) refers to underlying pathological process.
b) High wt. for age: seldom used for public health purposes.
The proper descriptive term for high wt. for age would be
heaviness.
Other anthropometric indices:
1) mid upper arm circumference : The advantage of MUAC
include the portability of measuring tapes and the fact that
a single cut – off value ( 12.5-13.0 cm) can be used for
children under 5 years of age .
2) Body mass index.
3) Skin fold: assess the thickness of subcutaneous tissue and
are widely used for assessing obesity among adults.
4) Head circumference
occipital – frontal circumference)
used as a part of health screening for potential
developmental or neurological disabilities in children.
5) 5-proxies for length: limitation in obtaining accurate
measurements of infant length. Potential proxies include
leg (or fibular) and arm (or ulnar) length as well as head
circumference.