9
Lecture 2 - Data Entry
When we are creating a new data set, it is typical to start by definining the
names and other properties of the variables first and then entering the
specific values into each variable for each independent source of data. Recall
that there is one row for each independent source of data and one column for
each characteristic (i.e., variable) that we have measured from each data
source. There are times, however, when we decide to add additional variables
after we have entered some of the data. Adding variables after the fact does
not present any special challenges; we simply go to the variable view, click in
an empty row, and start defining our new variables as we do below.
The first
step to defining variable names and properties is to select the variable view
tab in the data window. Then we can create (or edit) each of the properties
below.
Name
The name of each SPSS variable in a given file must be unique; it must
start with a letter; it may have up to 8 characters (including letters,
numbers, and the underscore _ (note that certain key words are reversed
and may not be used as variable names, e.g., "compute", "sum", and so
forth). To change an existing name, click in the cell containing the name,
highlight the part you want to change, and type in the replacement. To
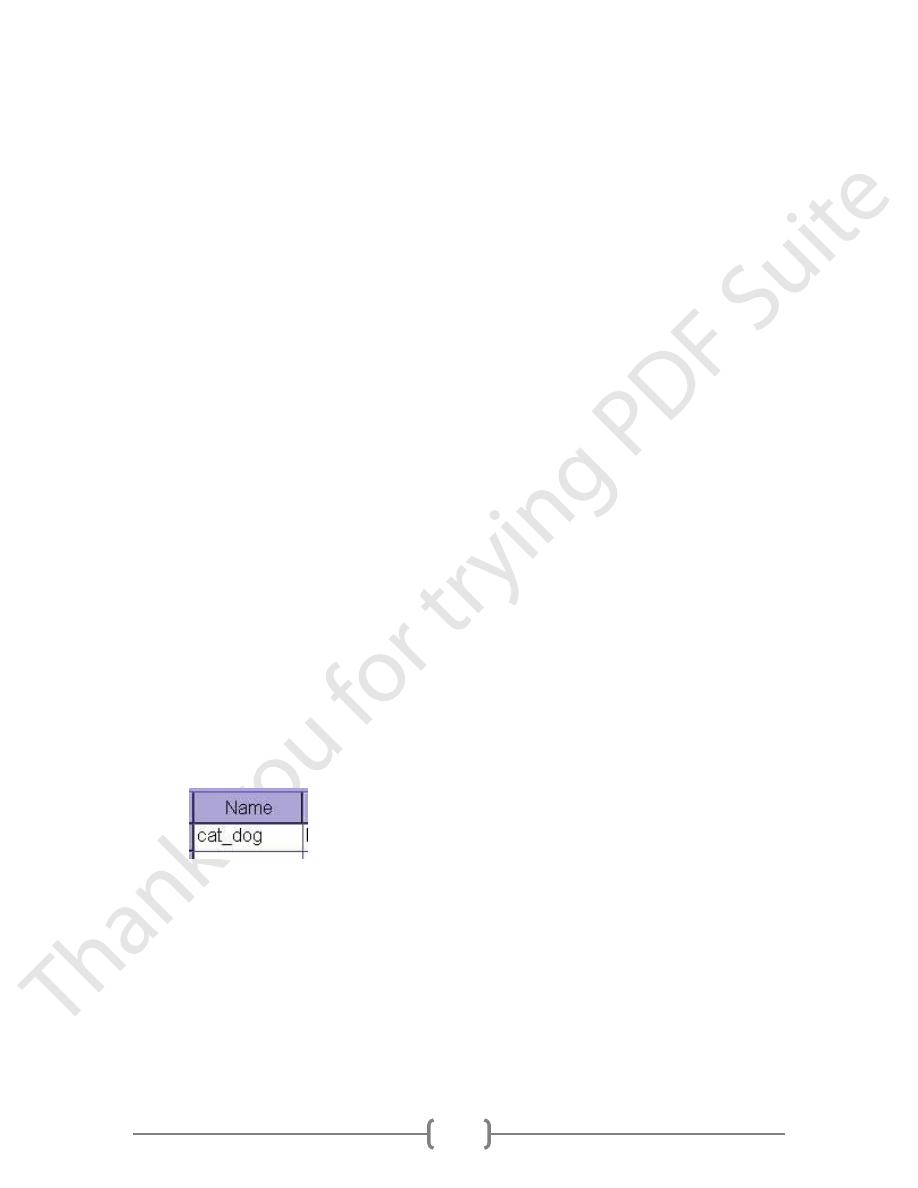
create a new variable name, click in the first empty row under the name
column and type a new (unique) variable name.
Notice that we can use "cat_dog" but not "cat-dog" and not "cat dog".
The hyphen gets interpreted as subtraction (cat minus dog) by SPSS, and
the space confuses SPSS as to how many variables are being named.
Type
The two basic types of variables that you will use
are
numeric
and
string. Numeric variables may only have numbers
10
assigned. String variables may contain letters or numbers, but even if a
string variable happens to contain only numbers, numeric operations on
that variable will not be allowed (e.g., finding the mean, variance,
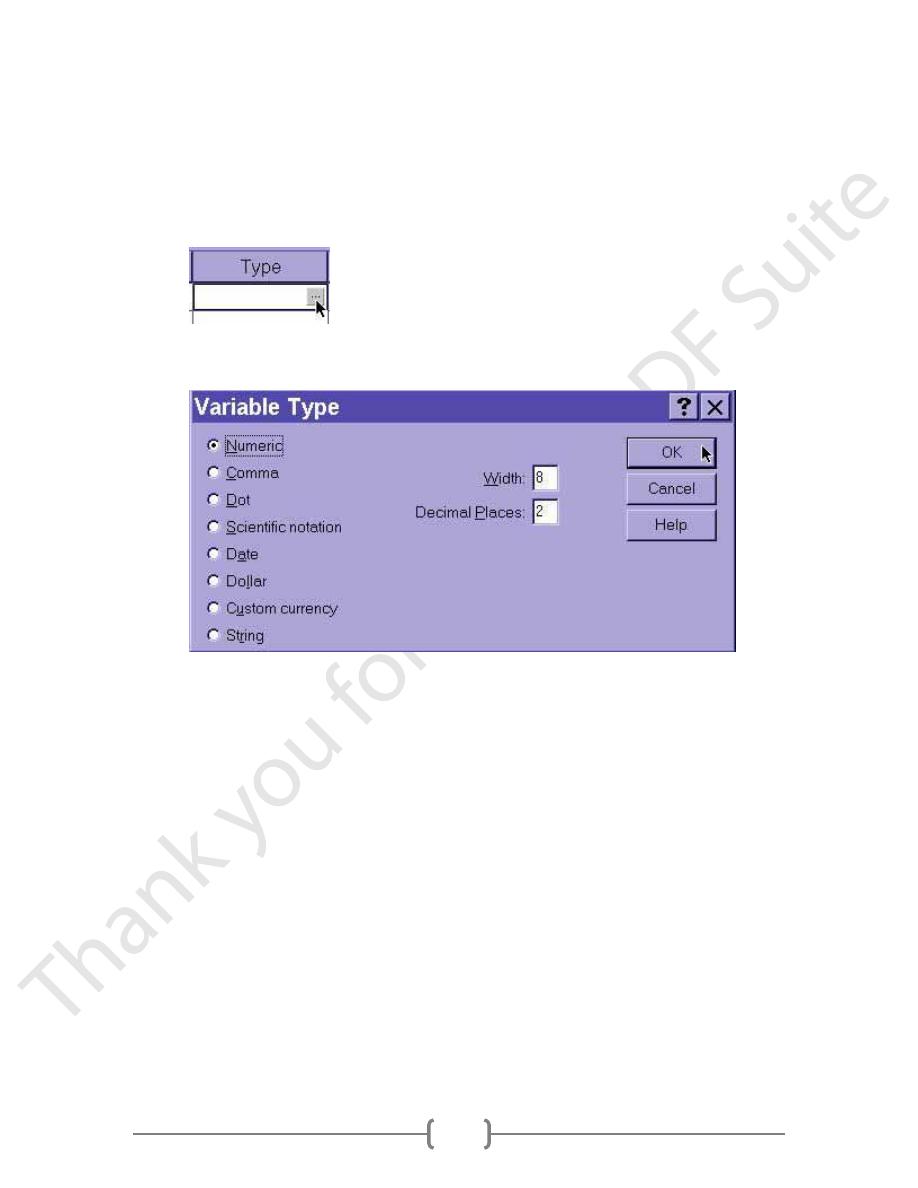
standard deviation, etc...). To change a variable type, click in that cell on
the grey box with ...
Clicking on this box will bring up the variable type menu:
If you select a numeric variable, you can then click in the width box or
the decimal box to change the default values of 8 characters reserved to
displaying numbers with 2 decimal places. For whole numbers, you can
drop the decimals down to 0.
If you select a string variable, you can tell SPSS how much "room" to
leave in memory for each value, indicating the number of characters to
be allowed for data entry in this string variable.
Width
The width of a variable is the number of characters SPSS will allow to
be entered for the variable. If it is a numerical value with decimals, this
total width has to include a spot for each decimal, as well as one for the
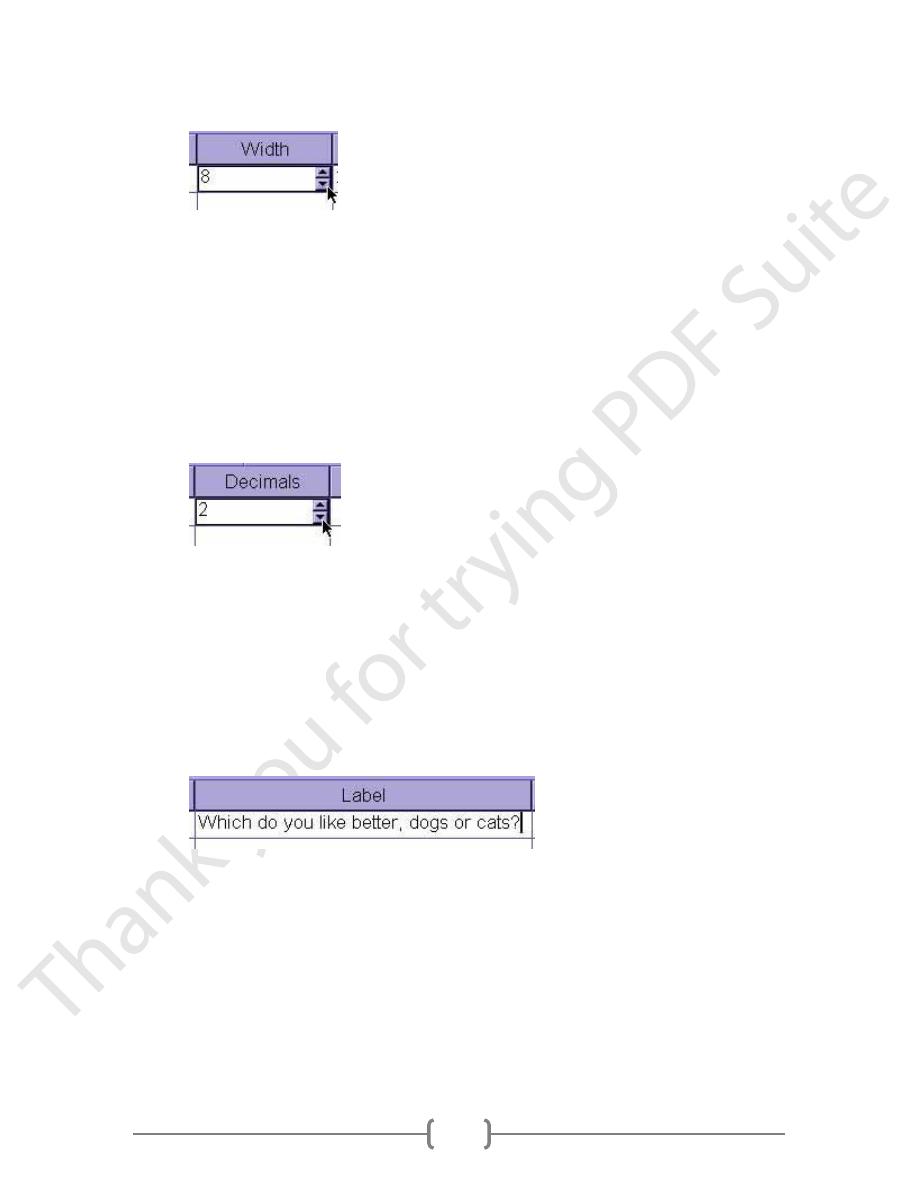
decimal point. You can change a width by clicking in the width cell for
the desired variable and typing a new number or you can use the arrow
keys at the edge of the cell
11
Decimals
The decimals of a variable is the number of decimal places that SPSS
will display. If more decimals have been entered (or computed by
SPSS), the additional information will be retained internally but not
displayed on screen. For whole numbers, you would reduce the number
of decimals to zero. You can change the number of decimal places by
clicking int he decimals cell for the desired variable and typing a new
number or you can use the arrow keys at the edge of the cell
Label
The label of a variable is a string of text to indentify in more detail what
a variable represents. Unlike the name, the label is limited to 255
characters and may contain spaces and punctuation. For instance, if there
is a variable for each question on a questionnaire, you would type the
question as the variable label. To change or edit a variable label, simply
click anywhere within the cell.
Values
Although the variable label goes a long way to explaining what the
variable represents, for categorical data (discrete data of both nominal
and ordinal levels of measurement), we often need to know which
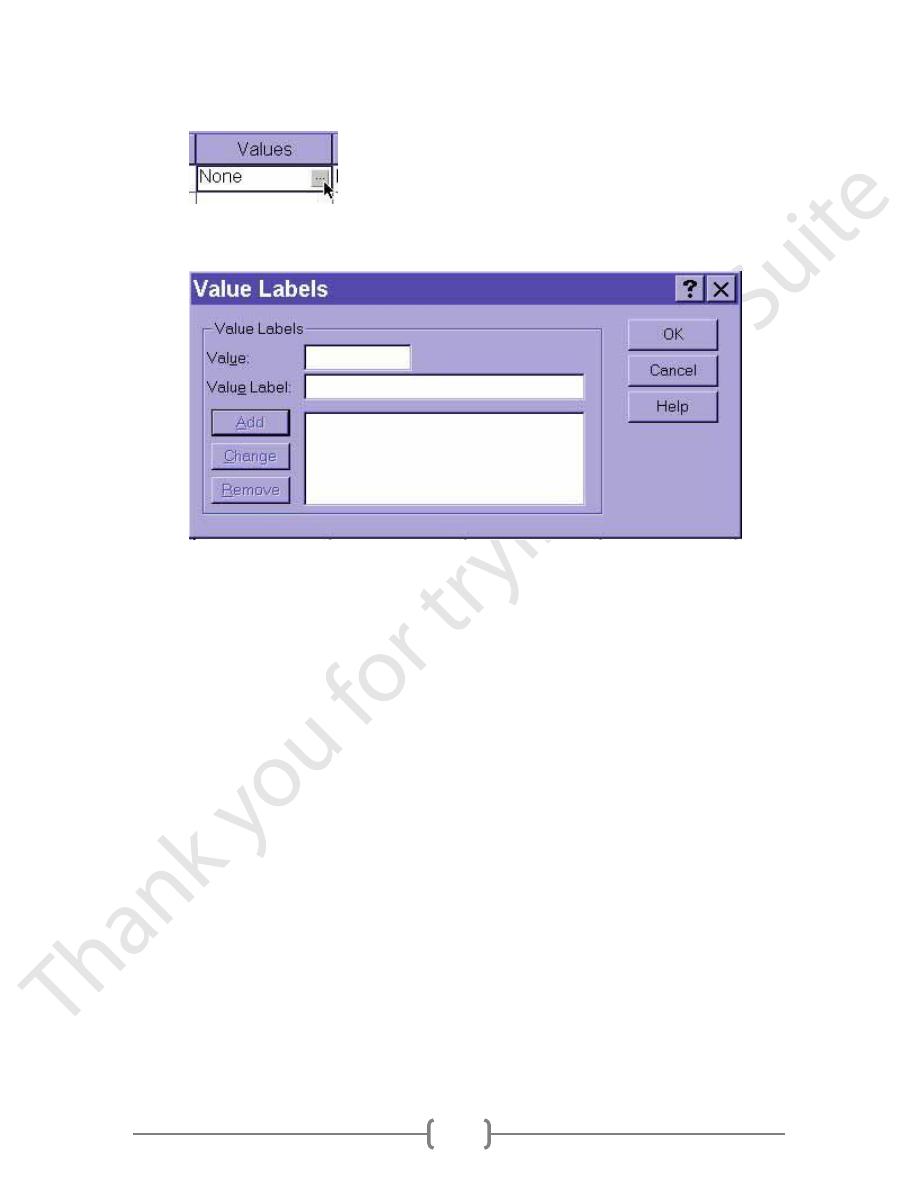
numbers represent which categories. To indicate how these numbers are
assigned, one can add labels to specific values by clicking on the ... box
in the values cell
12
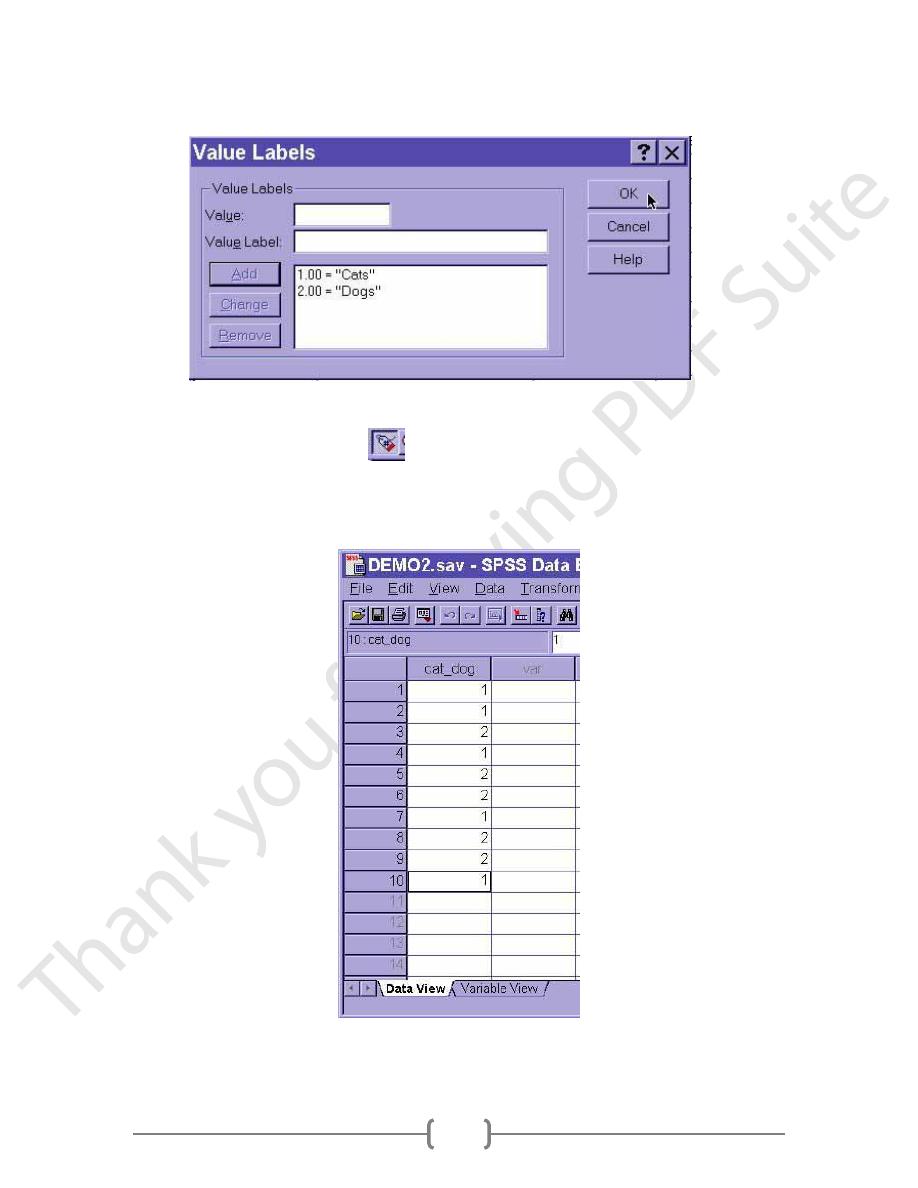
Clicking here opens up the Value Labels dialogue box.
Click in the Value field to type a specific numeric value
Click in the Label field to type the corresponding label
Click on the Add button to add this pair of value and label to the
list
You can remove a pairing created above by clicking on that pair and
then clicking on the delete button. Similarly, you can change pairing by
clicking on the pair, then typing in a new value, a new label, or both;
then, you click on the Change button. When you are satisfied with the
definitions of each value, click on the OK button
13
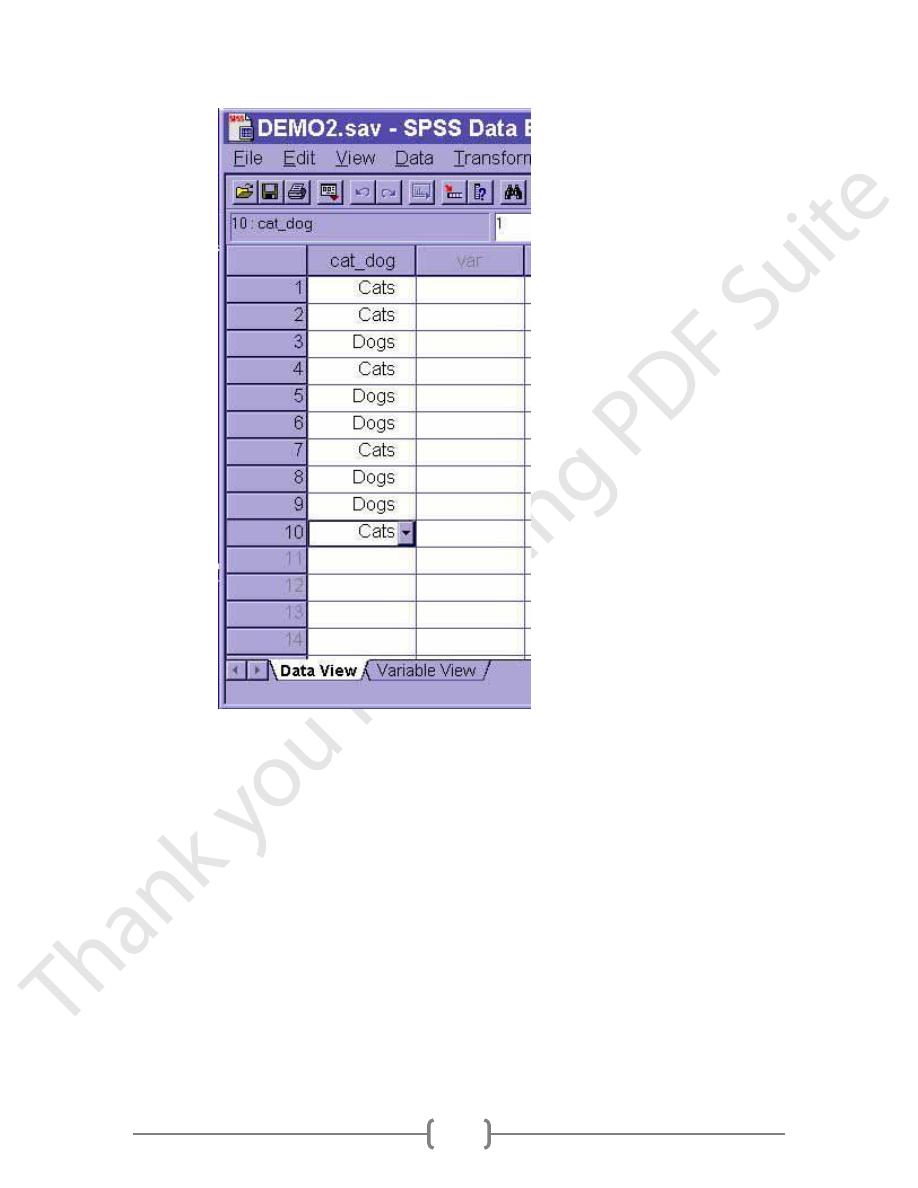
The real beauty of value labels can be seen in the Data View by clicking on the
"toe tag" icon in the tool bar
, which switches between the numeric values
and their labels
14
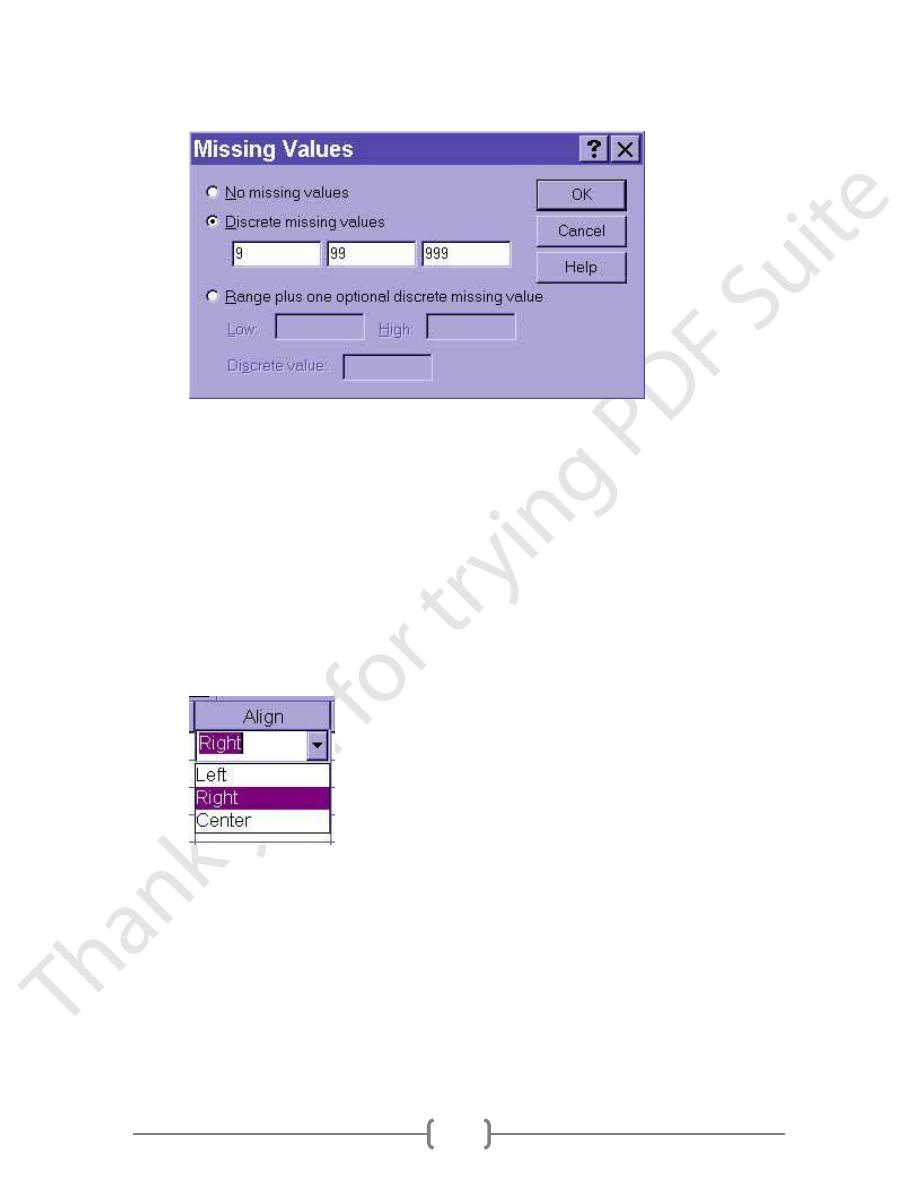
Missing
We sometimes want to signal to SPSS that data should be treated as
missing, even though there is some other numerical code recorded
instead of the data actually being missing (in which case SPSS displays a
single period -- this is also called SYSTEM MISSING data). In this
example, after clicking on the ... button in the Missing cell, I declared
"9", "99", and "999" all to be treated by SPSS as missing (i.e., these
values will be ignored)
15
Columns
The columns property tells SPSS how wide the column should be for
each variable. Don't confuse this one with width, which indicates how
many digits of the number will be displayed. The column size indicates
how much space is allocated rather than the degree to which it is filled.
Align
The alignment property indicates whether the information in the Data
View should be left-justified, right-justified, or centered
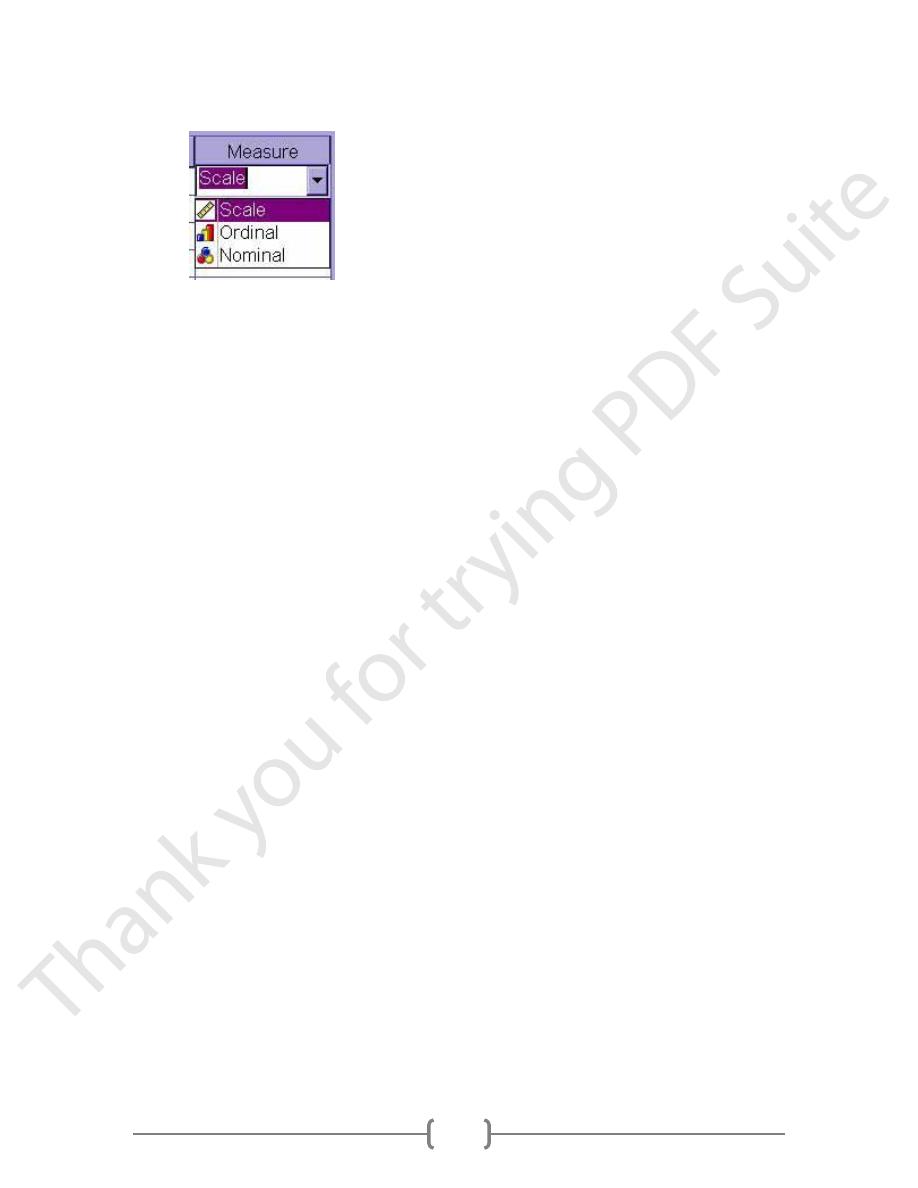
Measure
The Measure property indicates the level of measurement. Since SPSS
does not differentiate between interval and ratio levels of measurement,
both of these quantitative variable types are lumped together as "scale".
Nominal and ordinal levels of measurement, however,
are
differentiated
16
Entering the Data
The first step for entering the actual data is to click on the Data View tab.
To enter new data, click in an empty cell in the first empty row. The "Tab" key
will enter the value and jump to the next cell to the right. You may also use the
Up, Down, Left, and Right arrow keys to enter values and move to another cell
for data input.
To edit existing data points (i.e., the change a specific data value), click in the
cell, type in the new value, and press the Tab, Enter, Up, Down, Right, or Left
arrow keys.
Transform/Compute New Variable
SPSS has very powerful capabilities for creating new variables as a function of existing
variables. For instance, we can use these functions to create averages of existing
variables, to rescale existing variables, or to compute difference scores by subtracting one
variable from another. To do so, we select the Compute option from the Transform
menu:
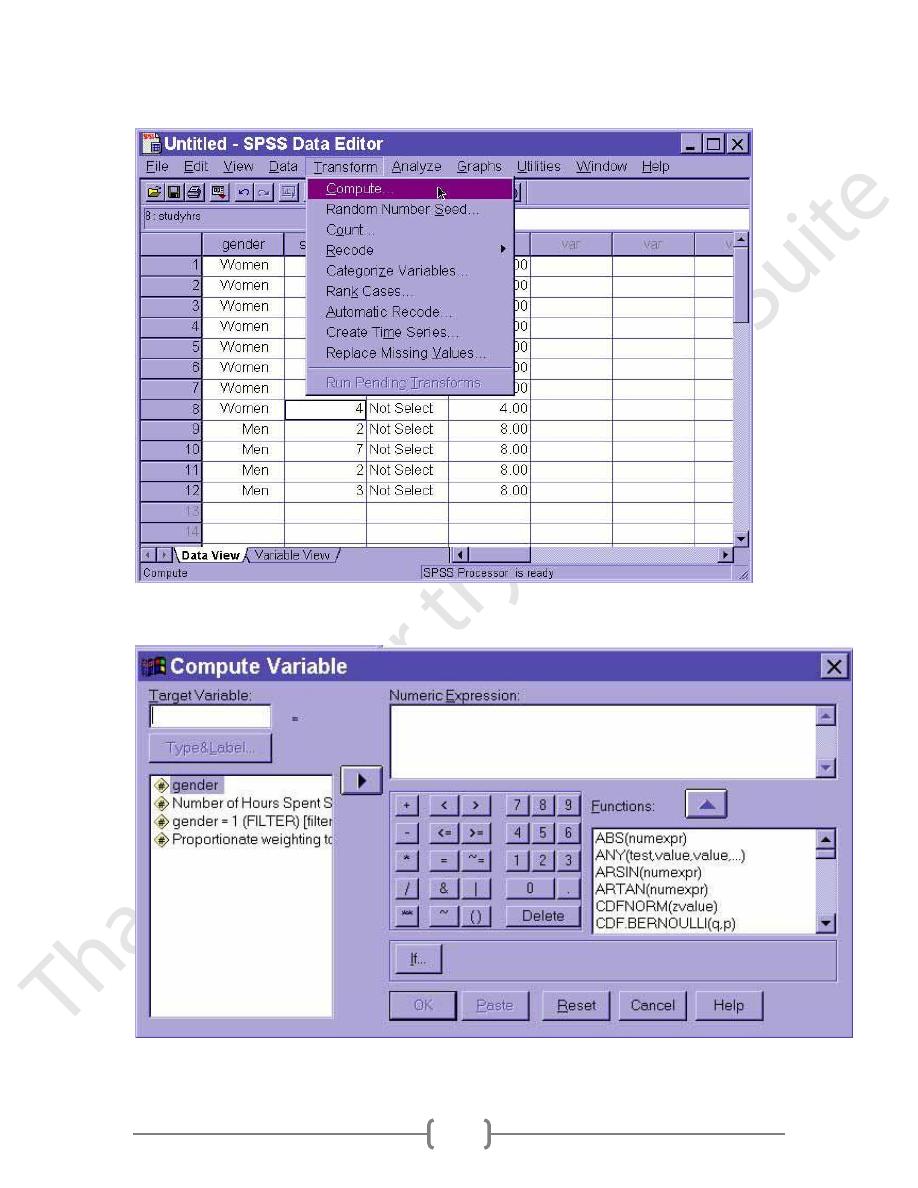
17
Selecting this option will bring up the compute dialogue box:
18
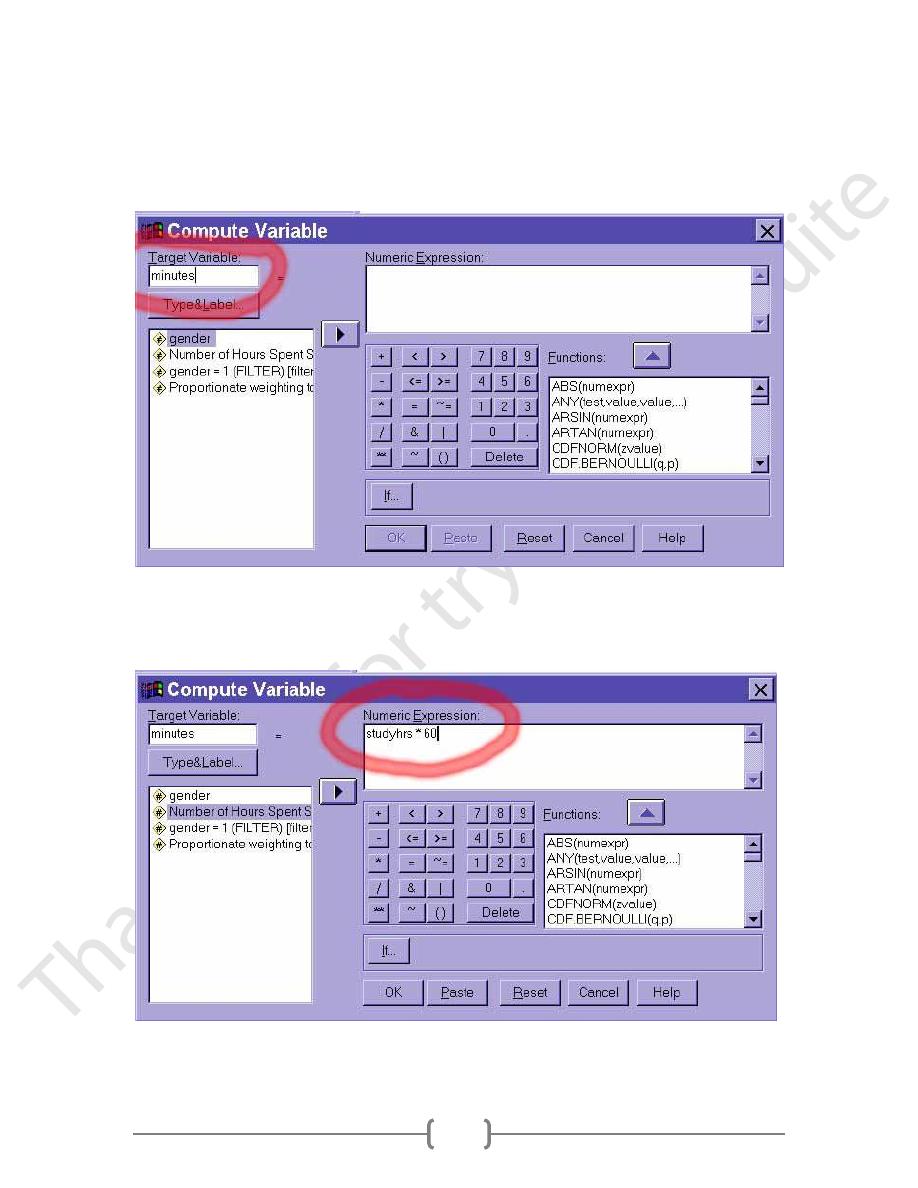
First, we need to supply a name for the target variable (i.e., the new variable SPSS will
create to contain the new values. For example, we may want to create a new variable to
report the number of minutes studied rather than the number of hours spent studying.
Thus, we would name the new variable "minutes":
The next step is to define for SPSS how the new values should be computed, essentially
giving SPSS a formula. To convert hours to minutes, we should multiply the studyhrs
variable times 60. Thus, we type "studyhrs*60" in the numeric expression field:
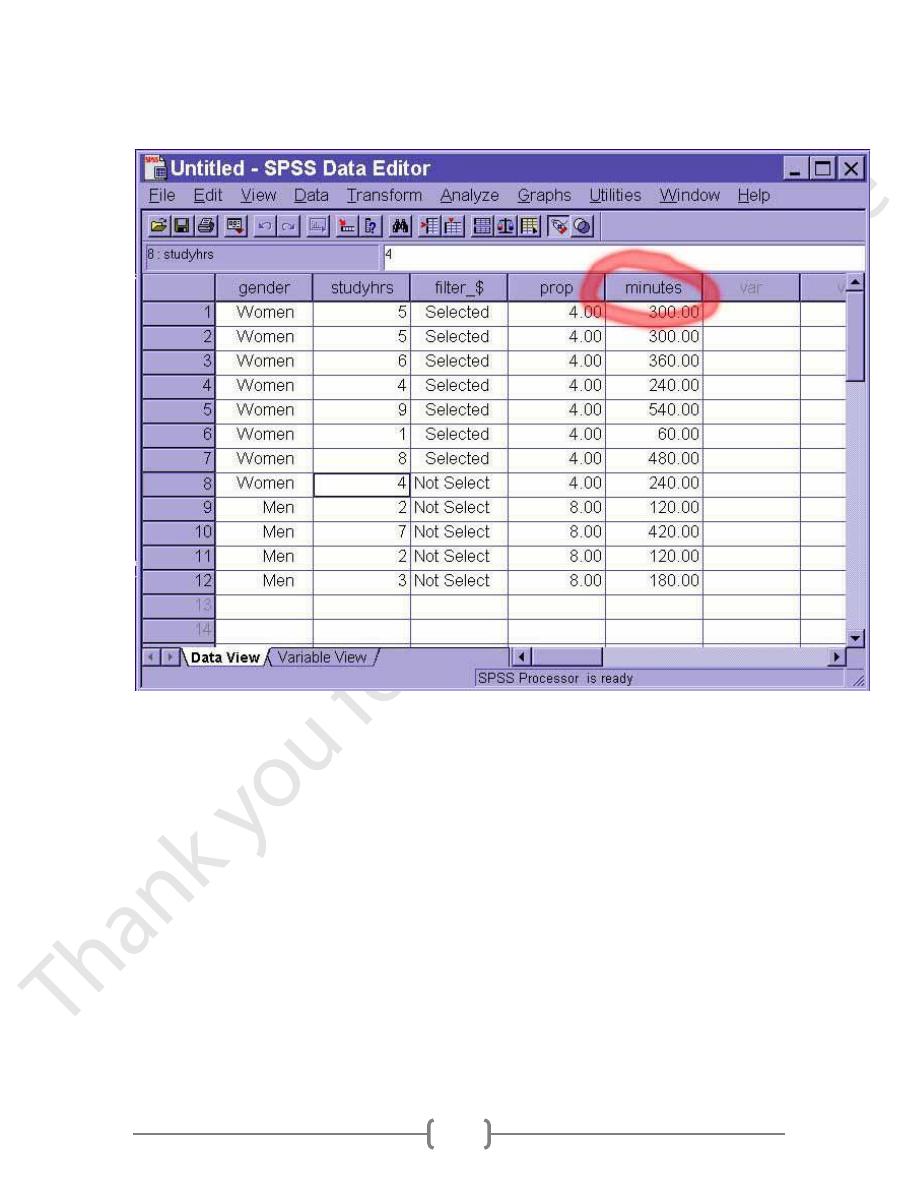
19
After we have clicked on the OK button, the new variable "minutes" is created: