Concrete Design
Ali N. Attiyah, Ph.D.
Fourth Year
2015-2016
1
Lecture nine
Equivalent Frame Method - General
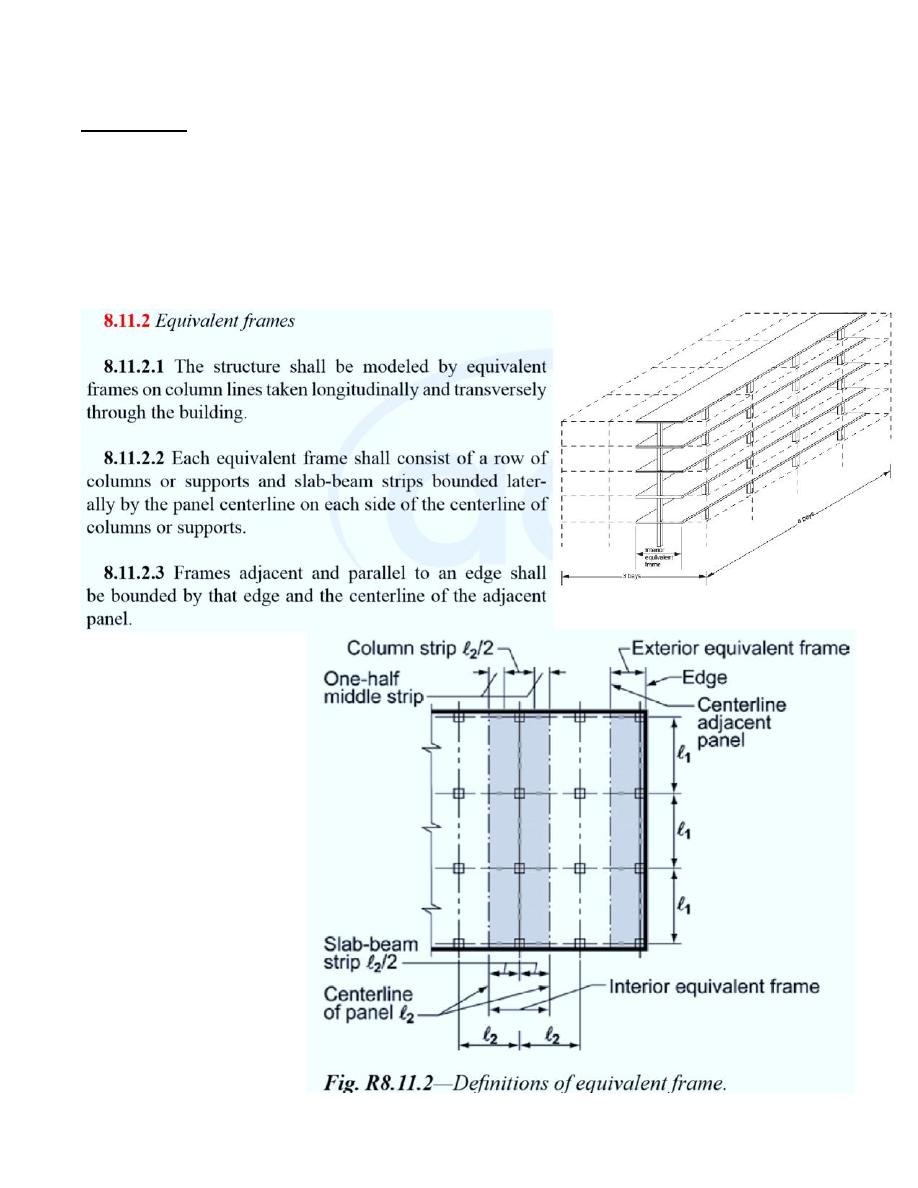
Equivalent Frame Method EFM is used to analyze and design structures not satisfy the
limitations of DDM. The building is divided into equivalent frames in both directions,
where each frame consists of slab-beam supported by columns.
Concrete Design
Ali N. Attiyah, Ph.D.
Fourth Year
2015-2016
2
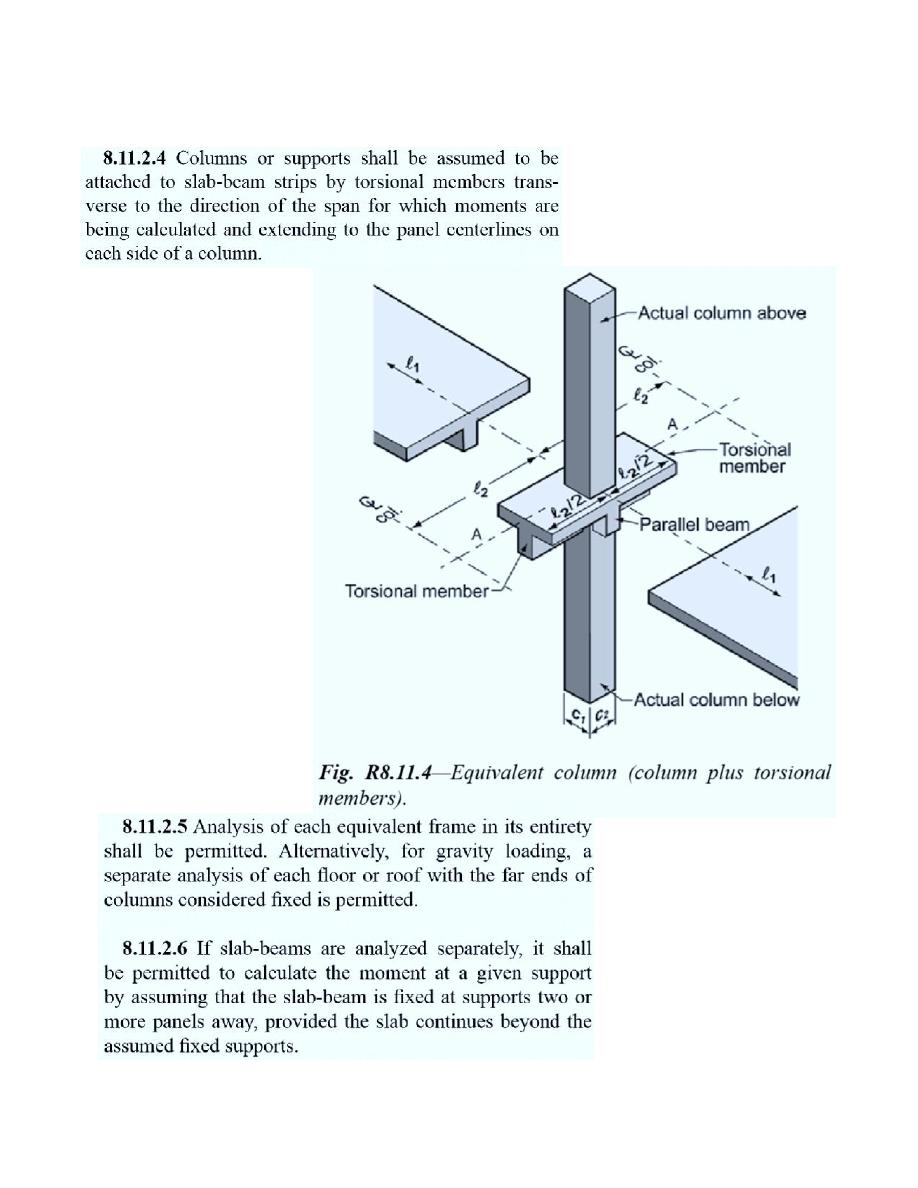
Torsional members attach the columns to slab-beam strips.
Concrete Design
Ali N. Attiyah, Ph.D.
Fourth Year
2015-2016
3
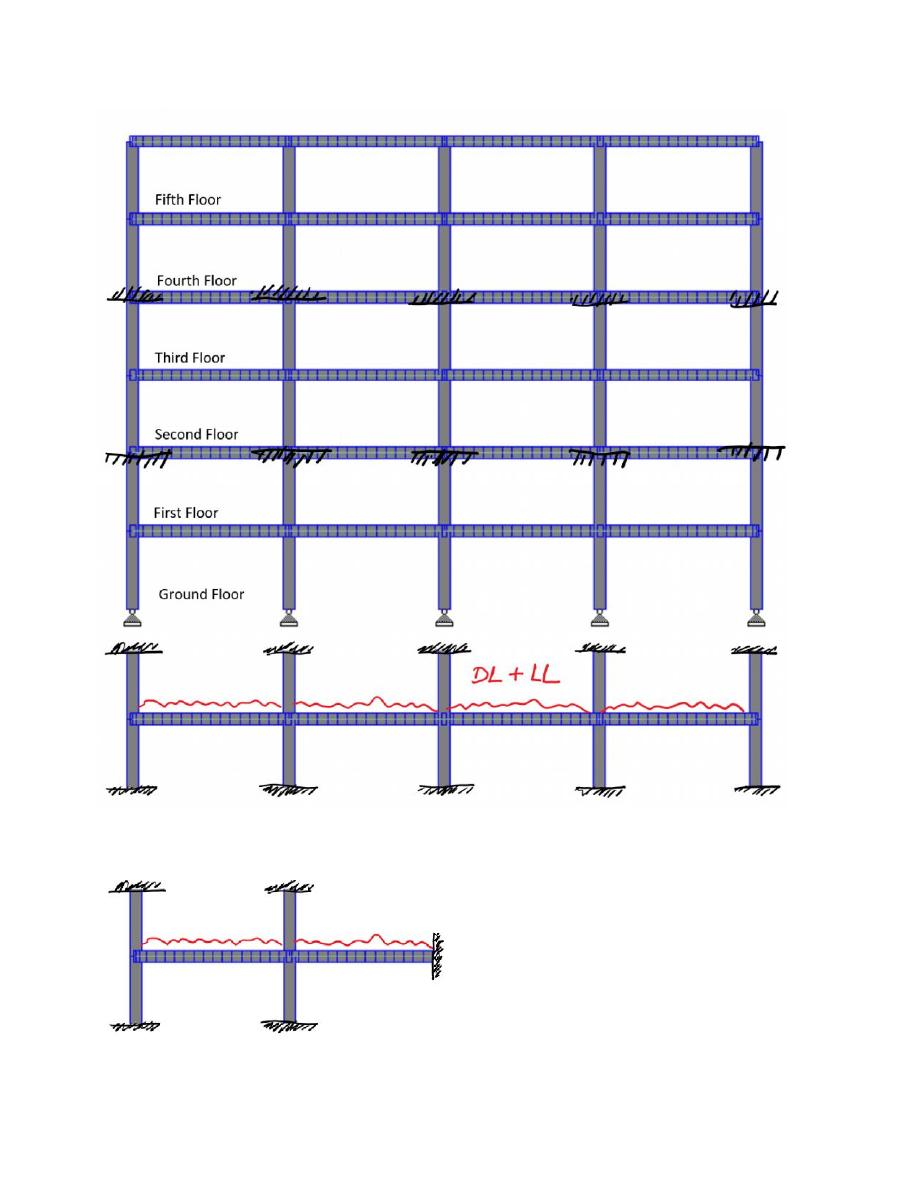
A
B
C
To calculate the moment at support A, it is permitted to analyze part of the frame
instead of the whole one.
What will be the frames used to find the moments at support B and C, respectively?
Concrete Design
Ali N. Attiyah, Ph.D.
Fourth Year
2015-2016
4
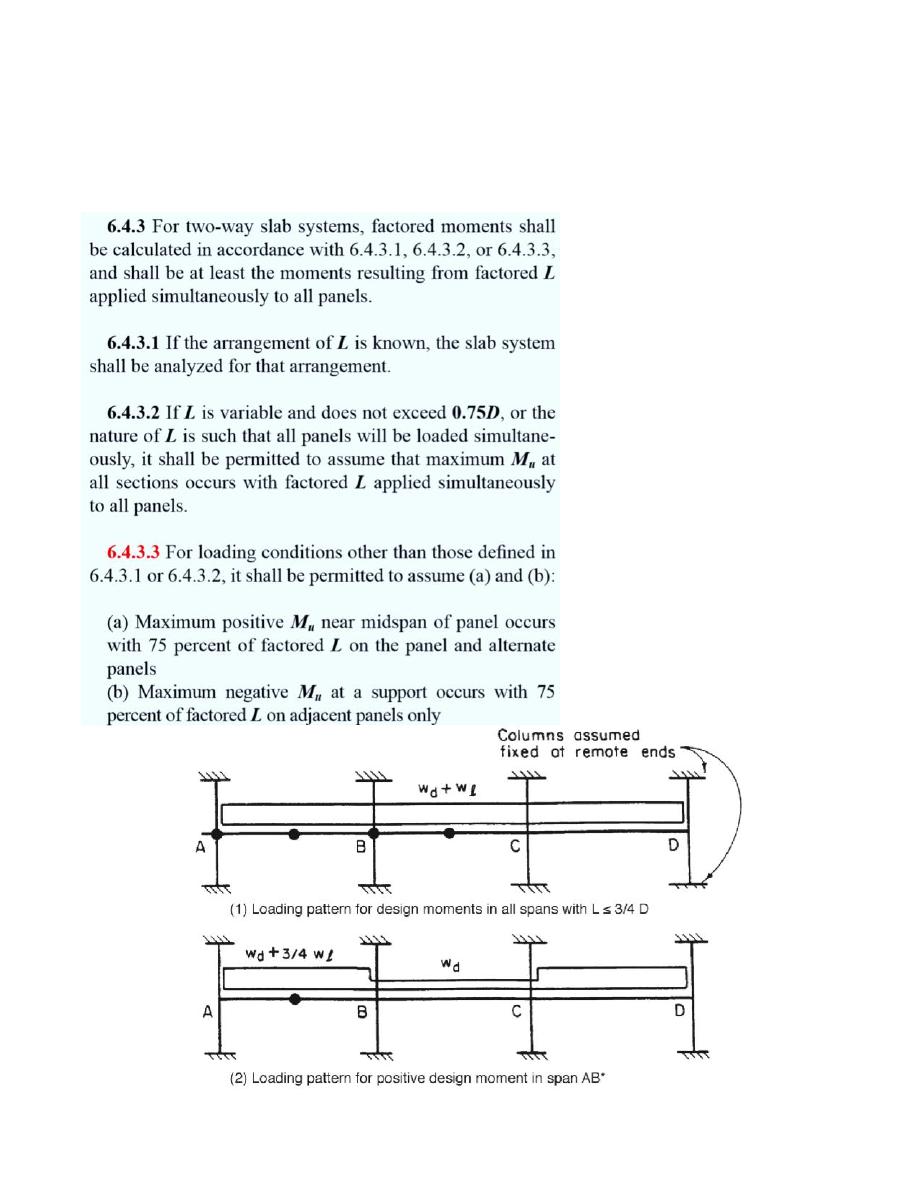
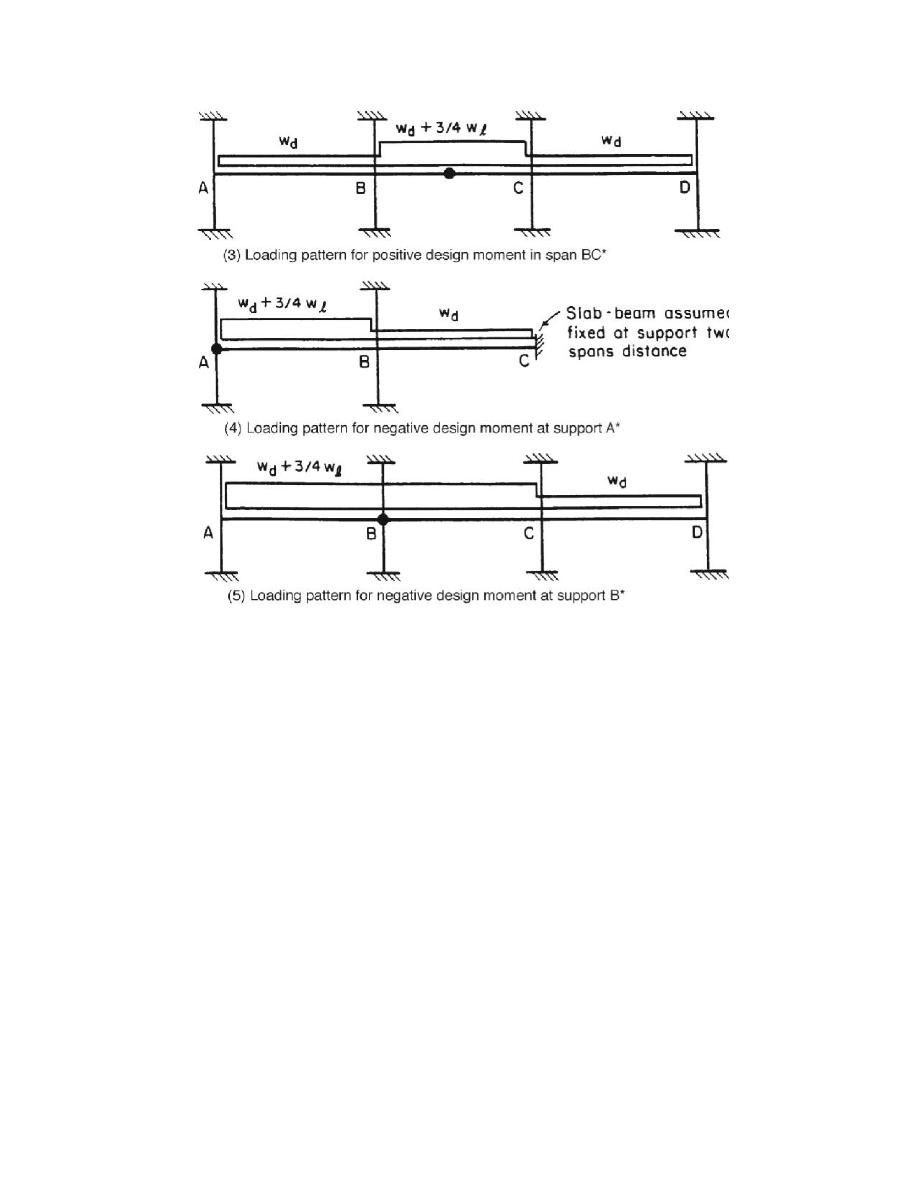
Live loads patterns
As the live loads not distributed equally on all spans by its nature, there are certain
patterns of loading may give the largest positive and negative moments.
Concrete Design
Ali N. Attiyah, Ph.D.
Fourth Year
2015-2016
5
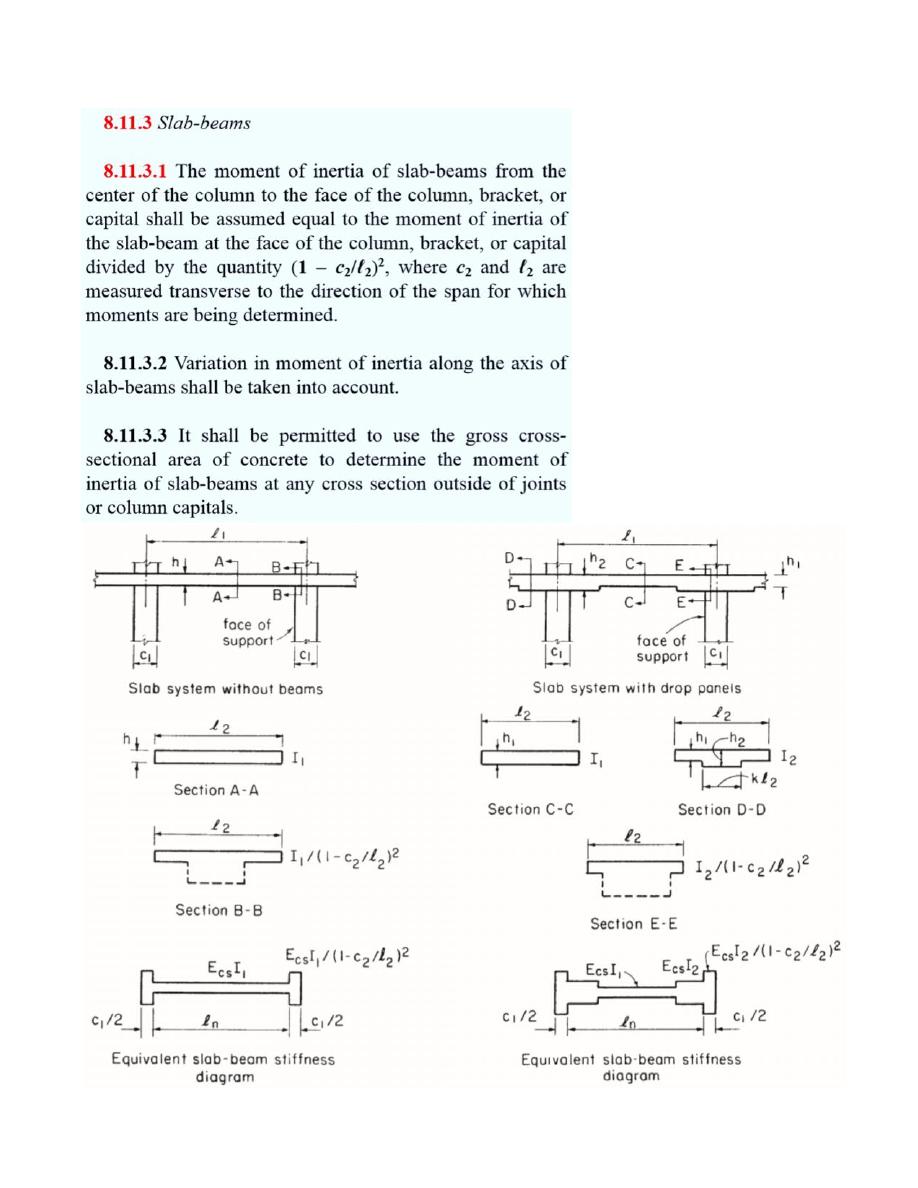
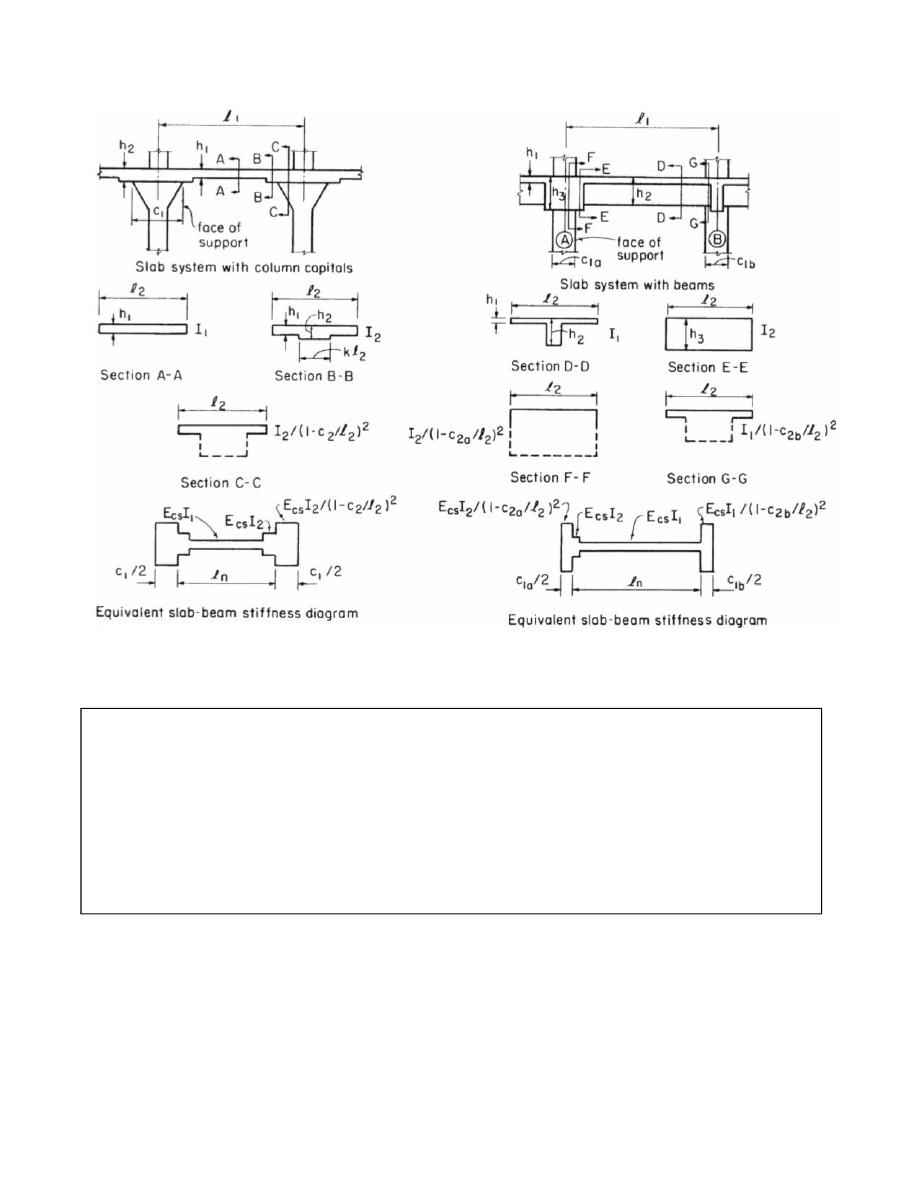
Flexural Stiffness of Slab-Beam Strip and Column
ACI 318-14 provisions calculate the flexural stiffness of the slab-beam strip and column,
which are used in computer or hand calculations. The moment of distribution method is
one of the common hand calculations method used to analyze the equivalent frame. The
moment distribution may be summarized in the following steps:
1- Fix all joints and calculate the fixed end moments at the ends of each span.
2- Release each joint and balance its moment.
3- Distribute the balance moment to the members linked to each joint according to
their stiffness (i.e. using distribution factor).
4- At each member, part of the moment shall be carried over the span to the far
end.
Concrete Design
Ali N. Attiyah, Ph.D.
Fourth Year
2015-2016
6
Concrete Design
Ali N. Attiyah, Ph.D.
Fourth Year
2015-2016
7
Example:
Concrete Design
Ali N. Attiyah, Ph.D.
Fourth Year
2015-2016
8
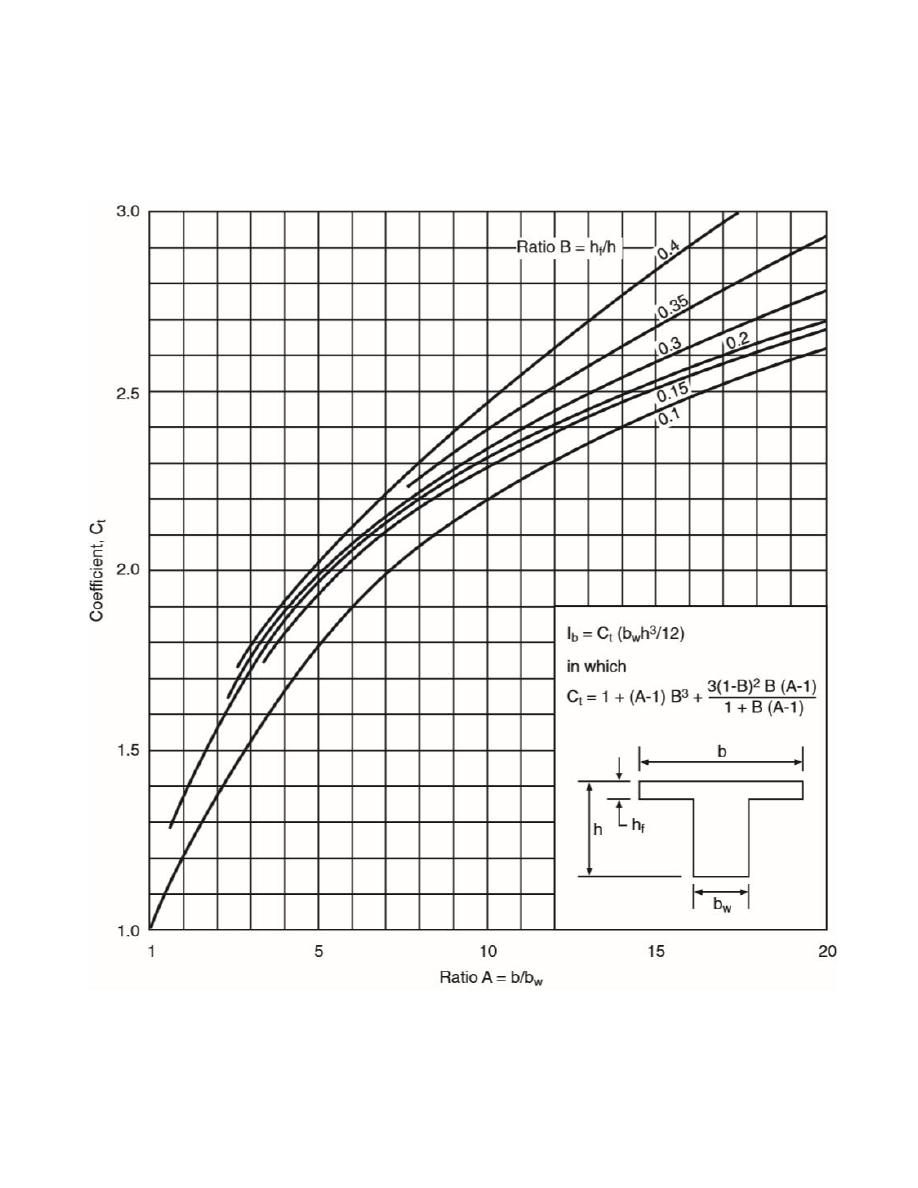
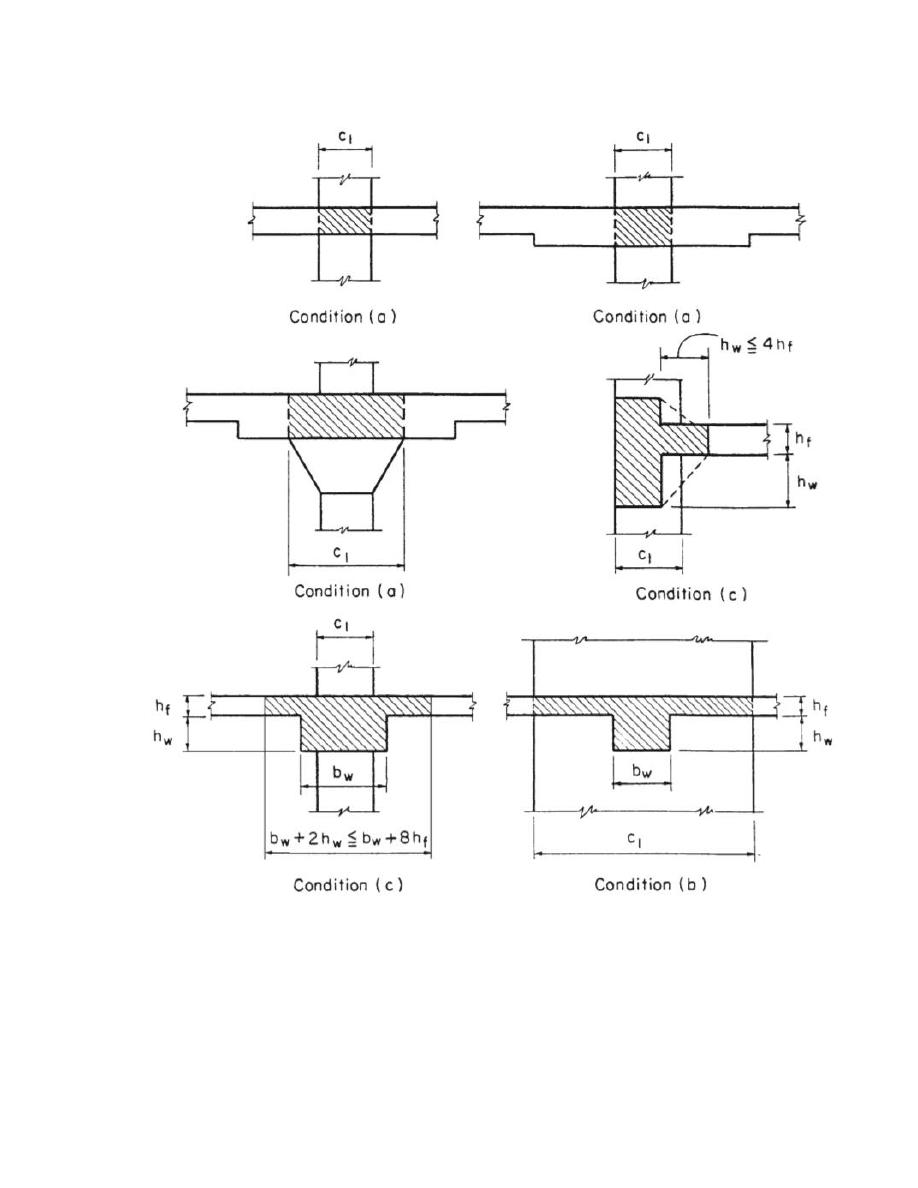
Moment of inertia of the slab-beam strip can be calculated from the following figure or
equation:
Concrete Design
Ali N. Attiyah, Ph.D.
Fourth Year
2015-2016
9
Concrete Design
Ali N. Attiyah, Ph.D.
Fourth Year
2015-2016
10
Concrete Design
Ali N. Attiyah, Ph.D.
Fourth Year
2015-2016
11
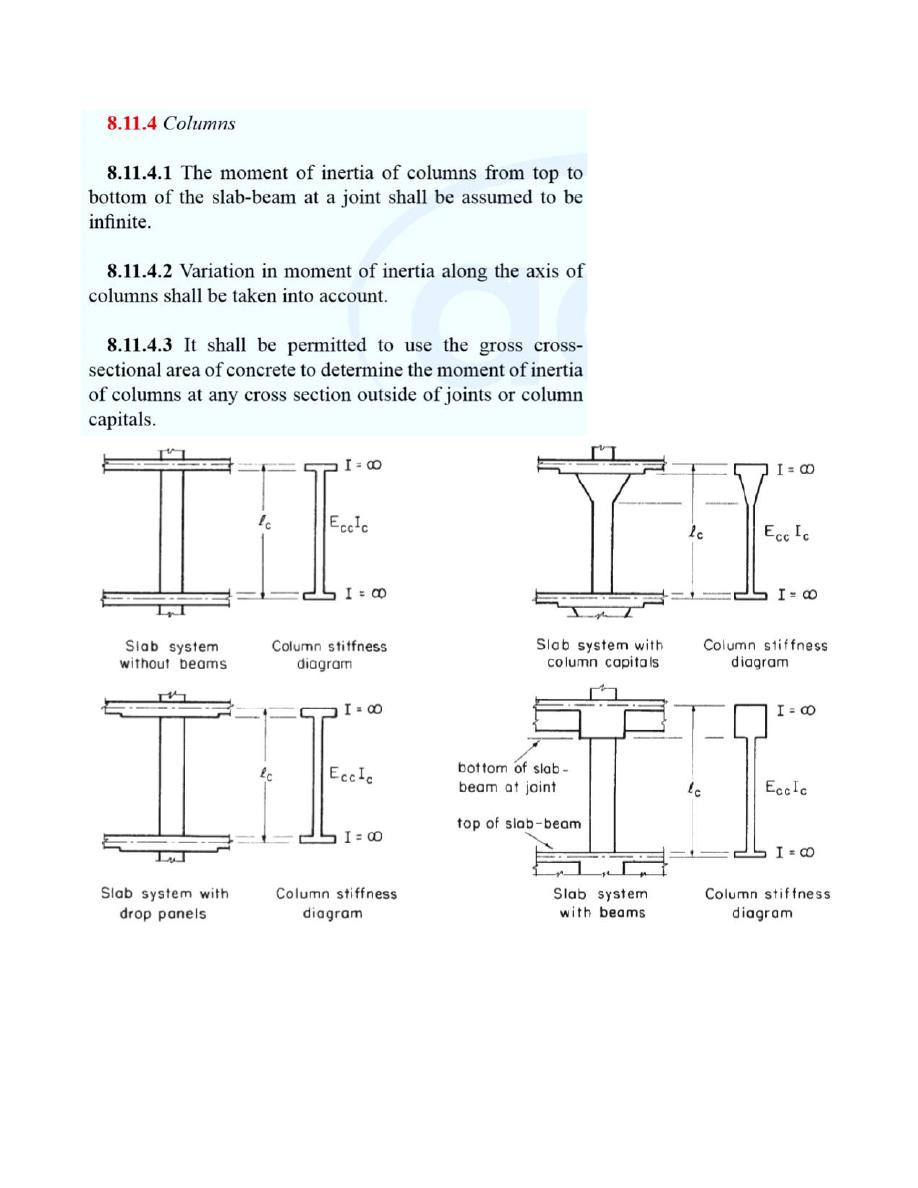
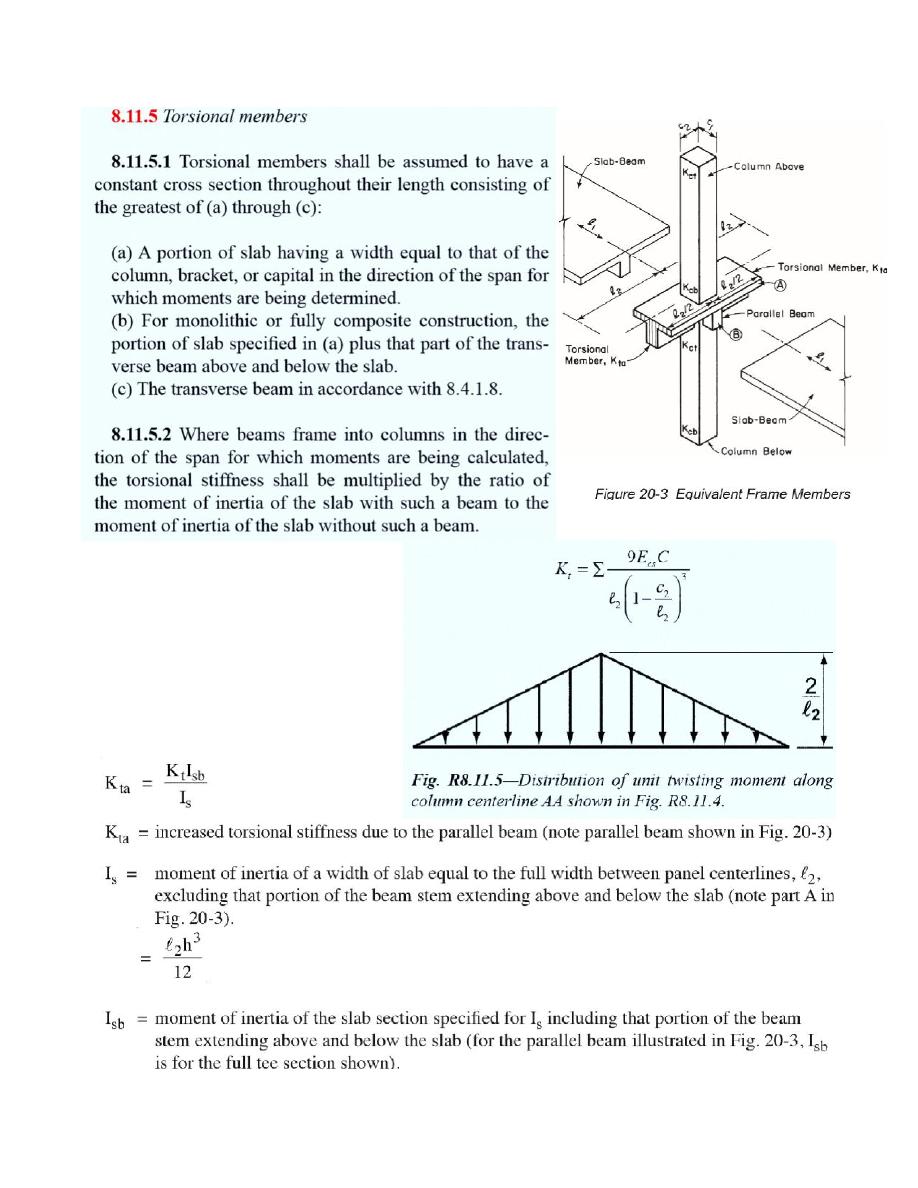
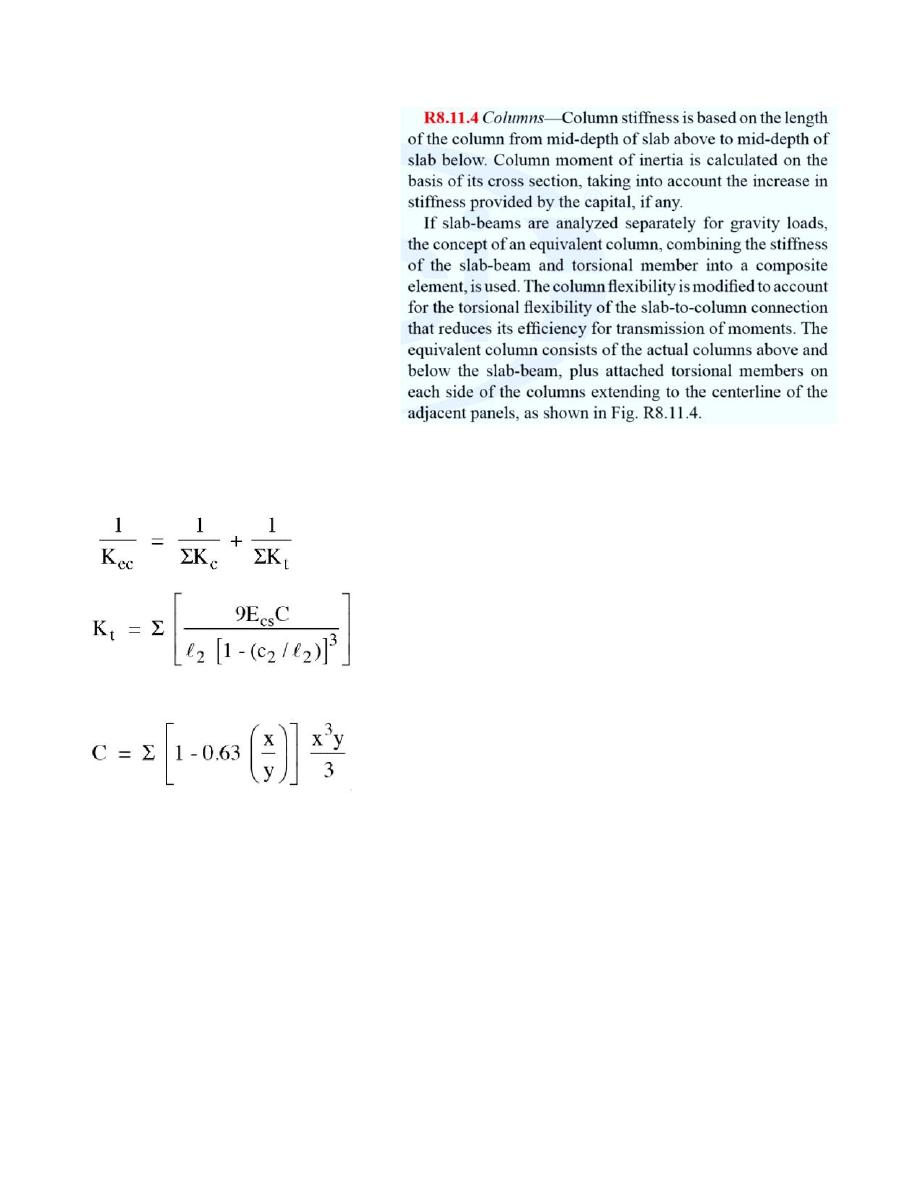
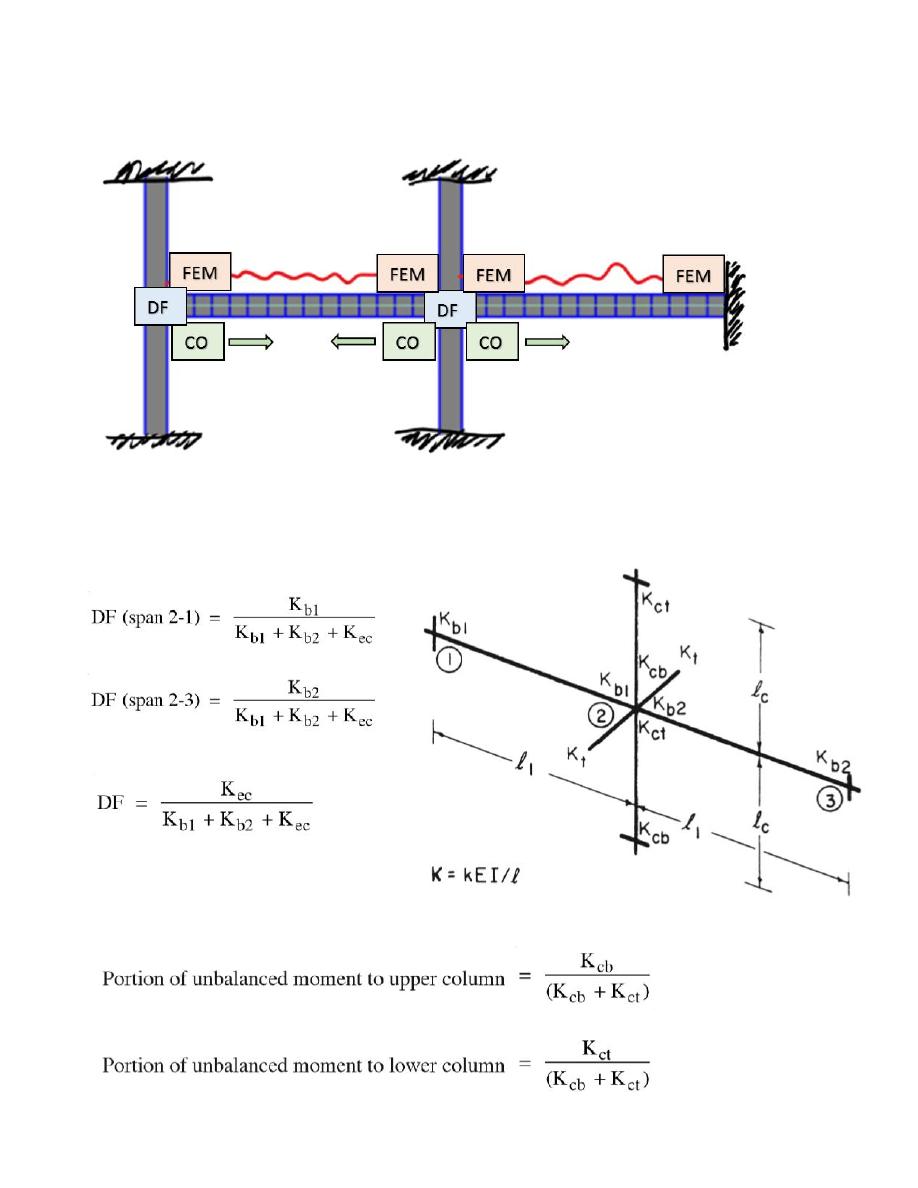
The equivalent column stiffness K
ec
is found from the following equation, where the
summation refers to the columns above and below joint and torsional members to the
both sides of joint:
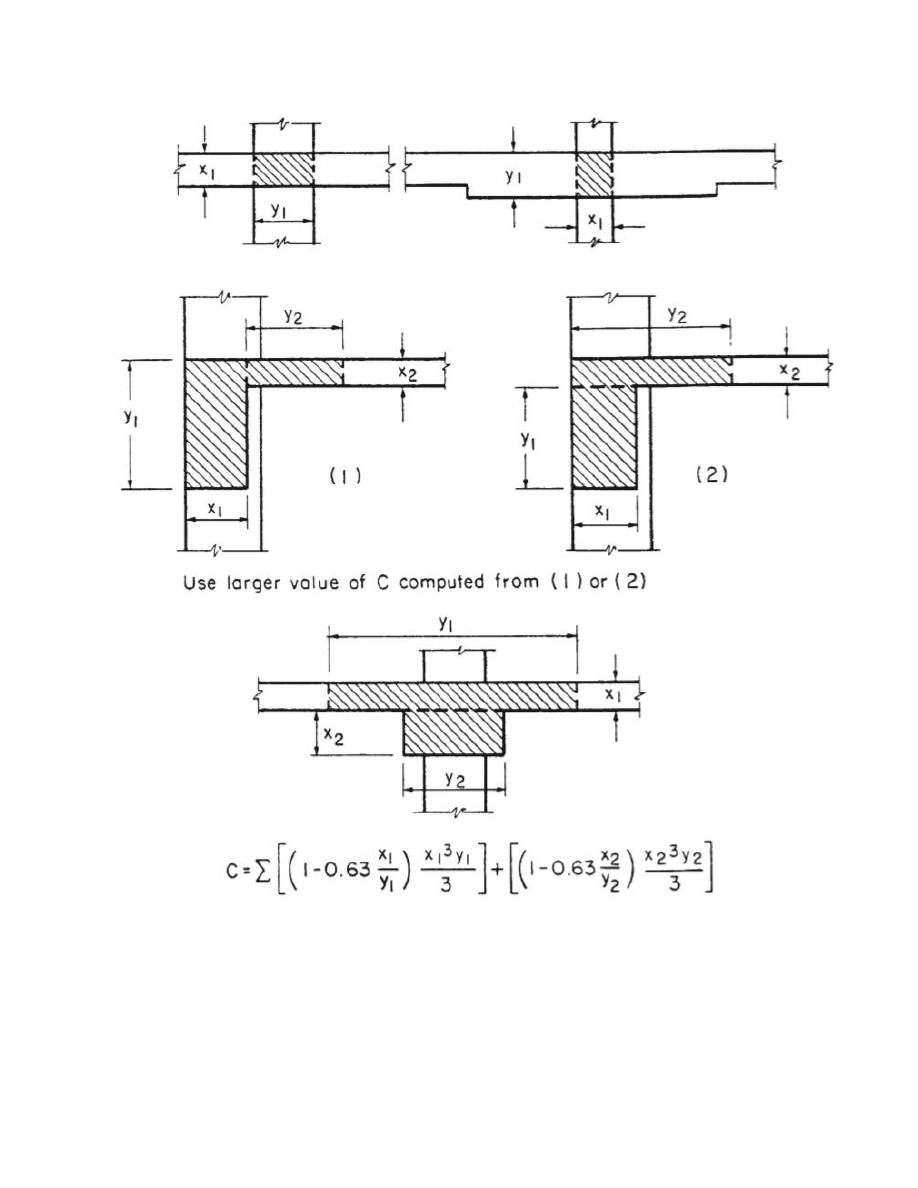
C is the torsional constant found from the following equation:
Concrete Design
Ali N. Attiyah, Ph.D.
Fourth Year
2015-2016
12
Concrete Design
Ali N. Attiyah, Ph.D.
Fourth Year
2015-2016
13
Concrete Design
Ali N. Attiyah, Ph.D.
Fourth Year
2015-2016
14
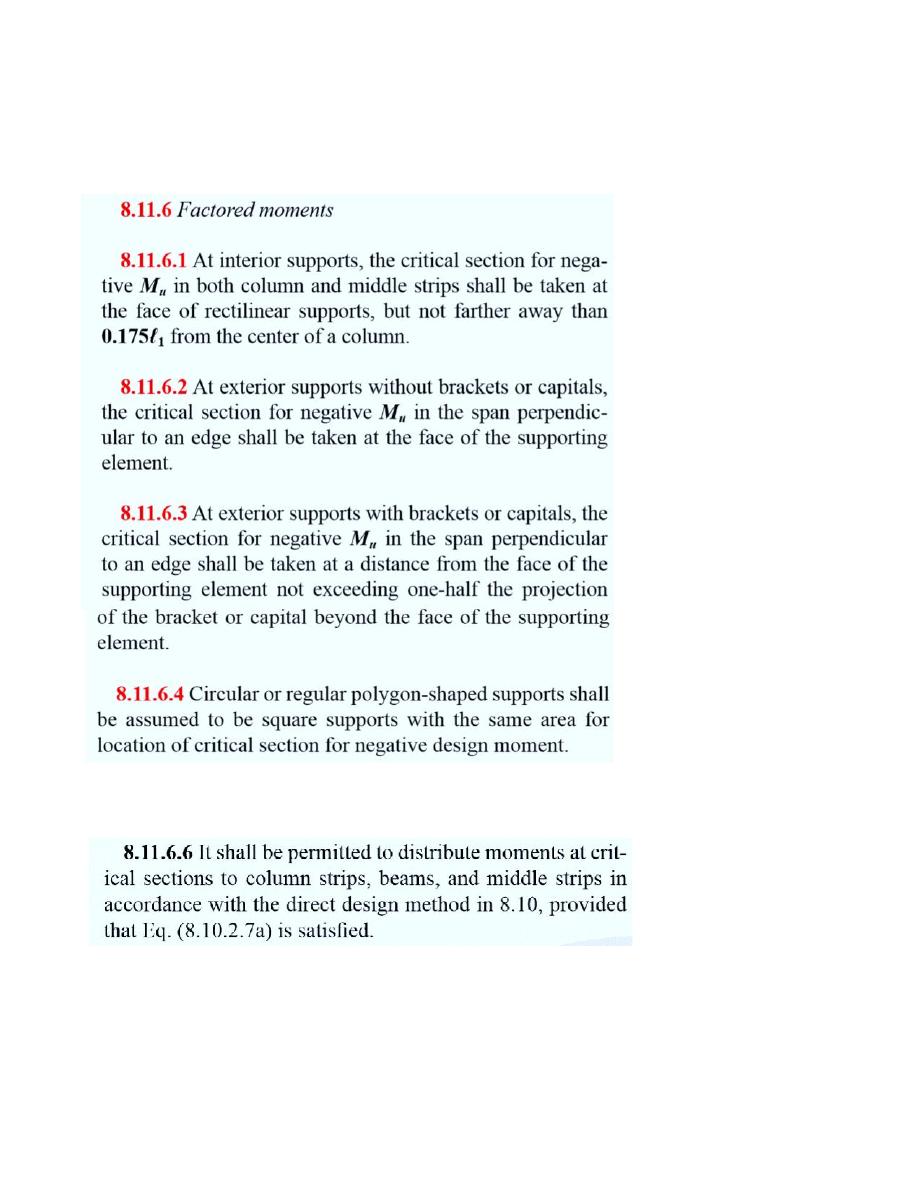
Frame Analysis Using Moment Distribution Method
Fixed End Moment FEM = Wu.L
2
/12 = 0.0833 Wu.L
2
Carry Over factor CO = 0.5
Distribution Factor DF = K
i
/ Σ K, where K = 4 E.I/ L
Moreover, for equivalent column:
The unbalanced moment determined for equivalent column shall be distributed to the
actual columns above and below joint as follows:
Concrete Design
Ali N. Attiyah, Ph.D.
Fourth Year
2015-2016
15
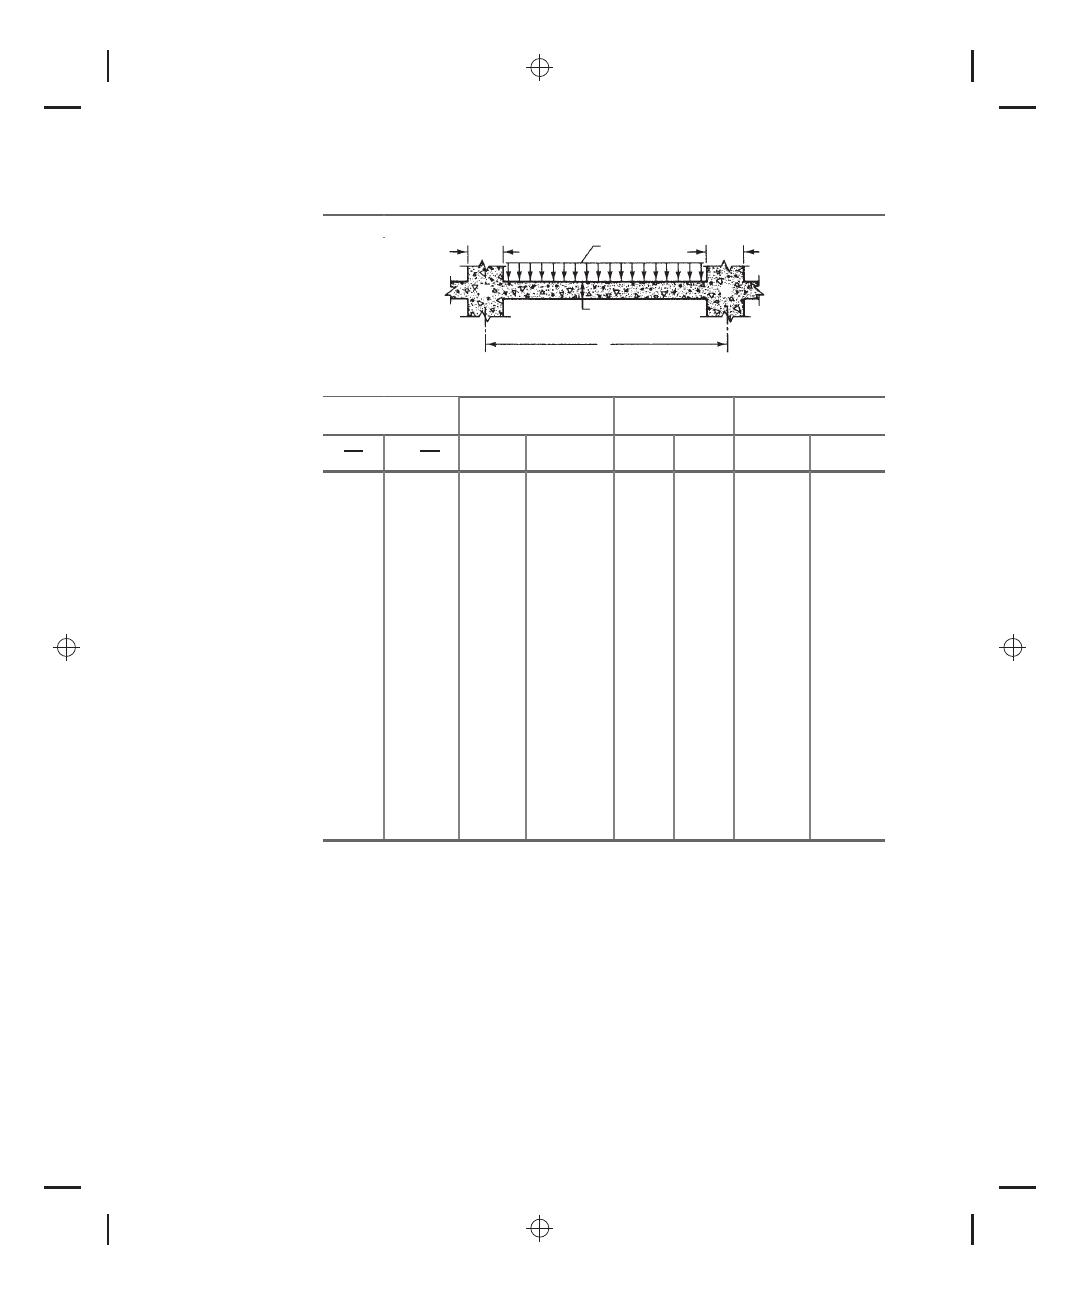
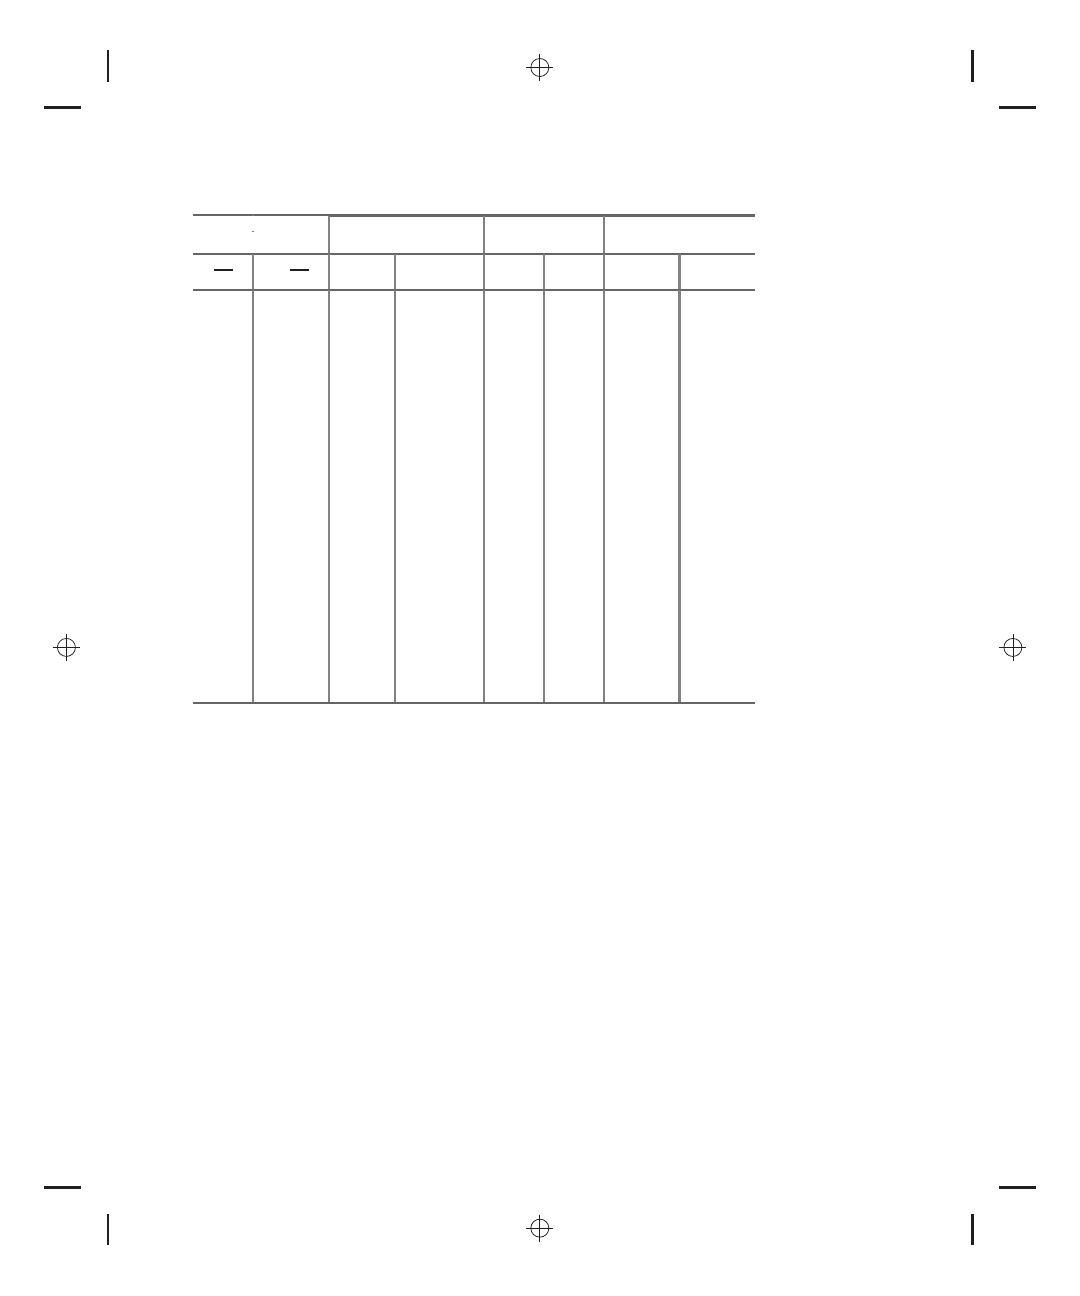
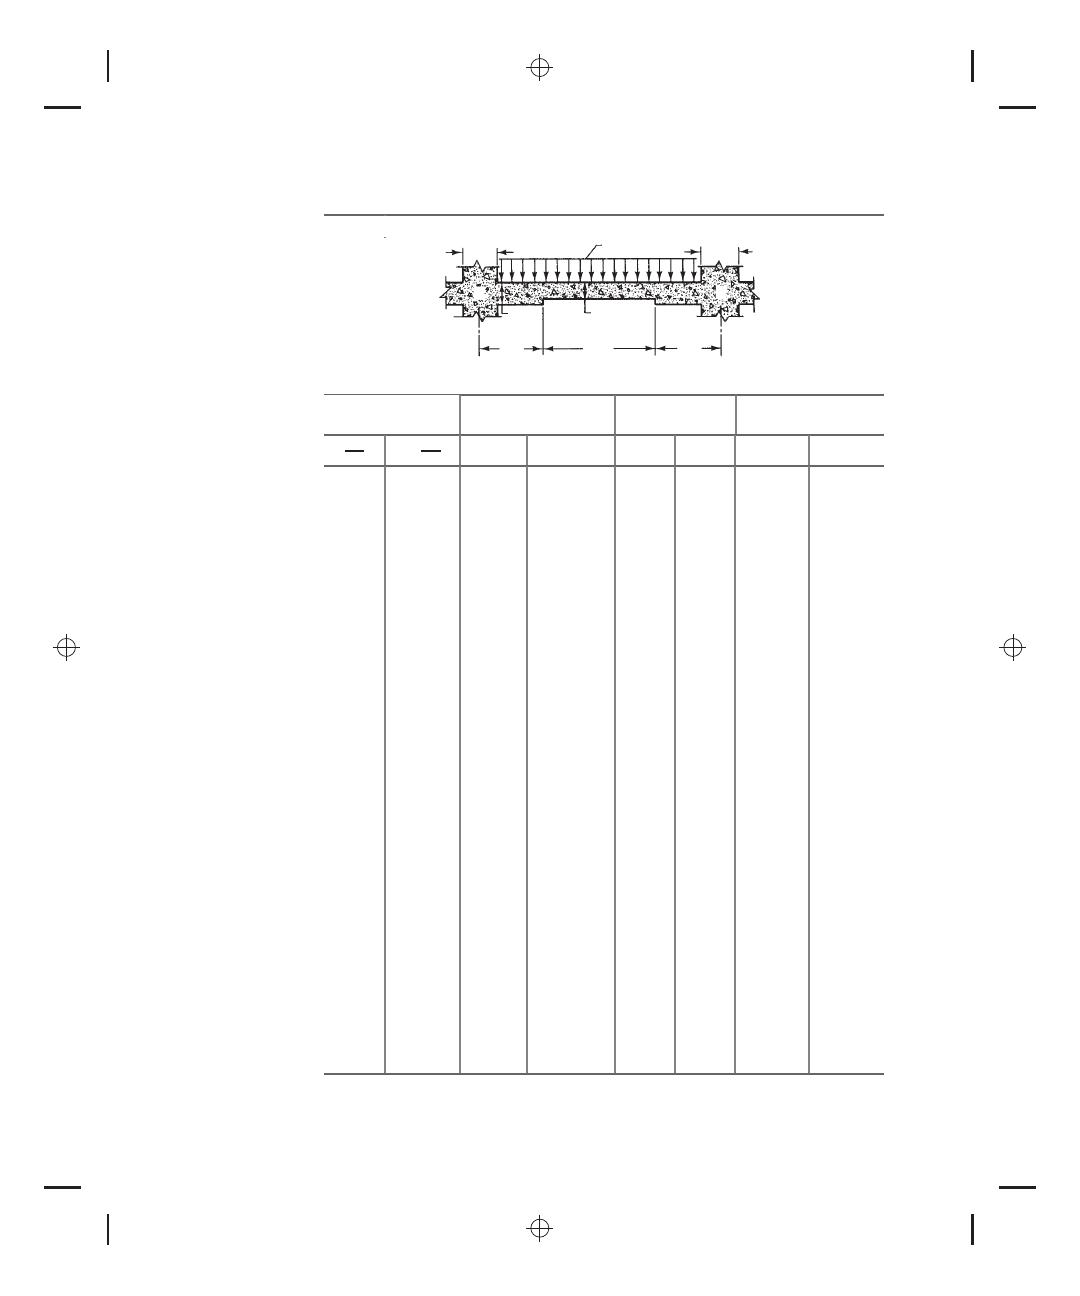
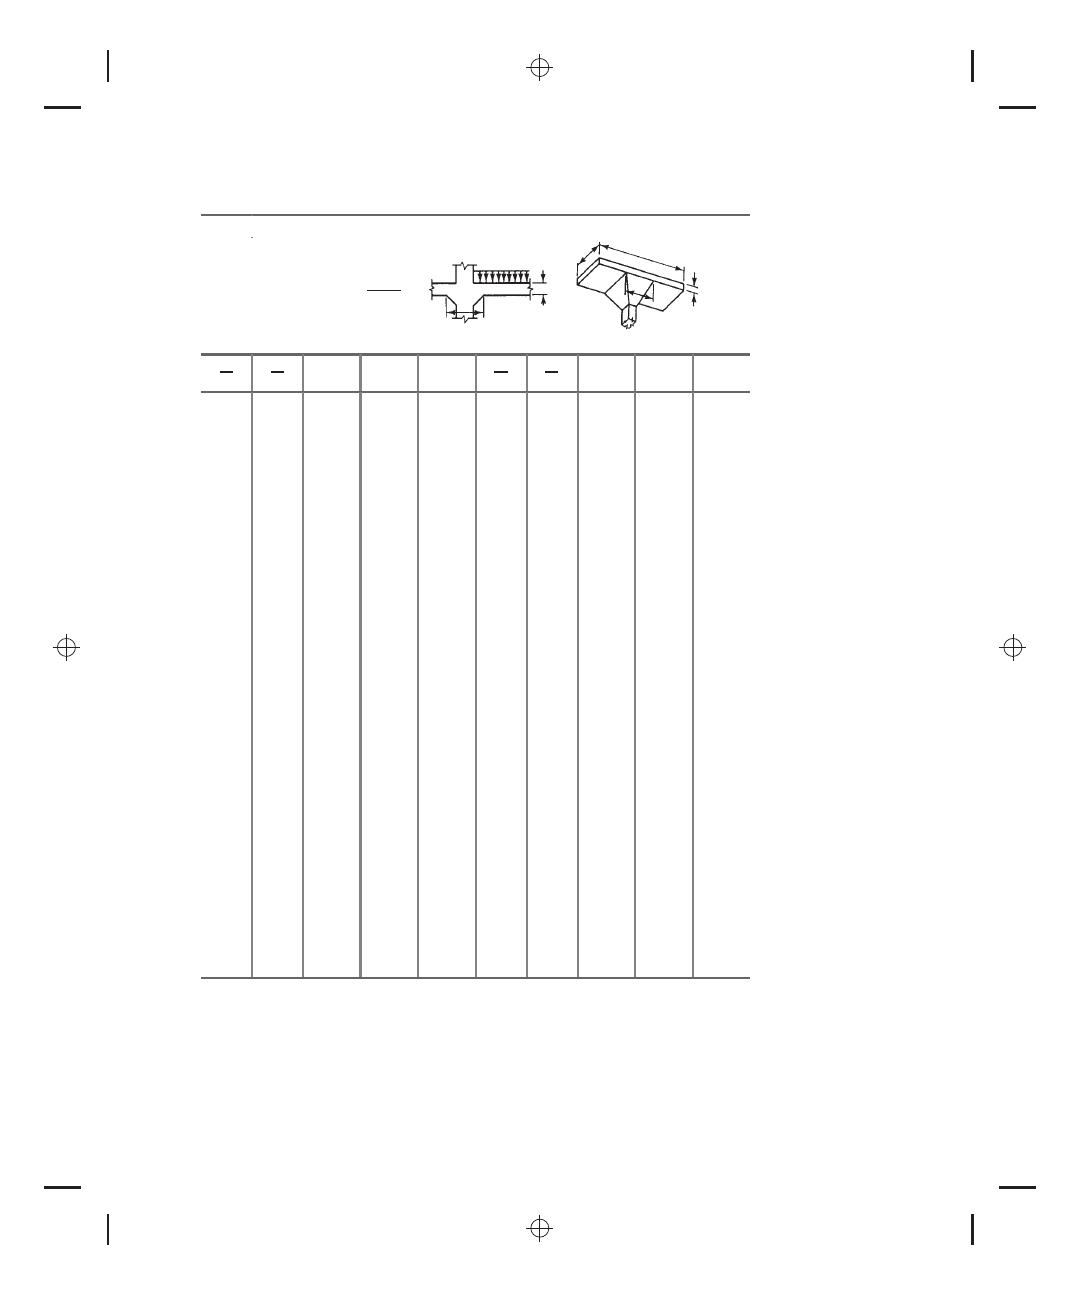
The values mentioned of FEM, CO, and K are used for prismatic members, but the slab-
beam and column are non-prismatic members. Hence, FEM, CO, and K will be found from
the attached tables.
Concrete Design
Ali N. Attiyah, Ph.D.
Fourth Year
2015-2016
16
Example:
McCormac
b01.tex
V2 - January 10, 2013
5:36 P.M.
Page 648
648
A P P E N D I X A
Tables and Graphs: U.S. Customary Units
T ABLE A.16
Moment Distribution Constants for Slabs Without Drop Panels
a
c
1A
A
B
w
h
C
L
C
L
`
1
c
1B
Column
Uniform Load
Stiffness
Carryover
Dimension
FEM
= Coef. (wl
2
l
2
1
)
Factor
†
Factor
c
1A
l
1
c
1B
l
1
M
AB
M
BA
k
AB
k
BA
COF
AB
COF
BA
0.00
0.083
0.083
4.00
4.00
0.500
0.500
0.05
0.083
0.084
4.01
4.04
0.504
0.500
0.10
0.082
0.086
4.03
4.15
0.513
0.499
0.15
0.081
0.089
4.07
4.32
0.528
0.498
0.00
0.20
0.079
0.093
4.12
4.56
0.548
0.495
0.25
0.077
0.097
4.18
4.88
0.573
0.491
0.30
0.075
0.102
4.25
5.28
0.603
0.485
0.35
0.073
0.107
4.33
5.78
0.638
0.478
0.05
0.084
0.084
4.05
4.05
0.503
0.503
0.10
0.083
0.086
4.07
4.15
0.513
0.503
0.15
0.081
0.089
4.11
4.33
0.528
0.501
0.05
0.20
0.080
0.092
4.16
4.58
0.548
0.499
0.25
0.078
0.096
4.22
4.89
0.573
0.494
0.30
0.076
0.101
4.29
5.30
0.603
0.489
0.35
0.074
0.107
4.37
5.80
0.638
0.481
0.10
0.085
0.085
4.18
4.18
0.513
0.513
0.15
0.083
0.088
4.22
4.36
0.528
0.511
McCormac
b01.tex
V2 - January 10, 2013
5:36 P.M.
Page 649
A P P E N D I X A
Tables and Graphs: U.S. Customary Units
649
T ABLE A.16
(Continued)
Column
Uniform Load
Stiffness
Carryover
Dimension
FEM
= Coef. (wl
2
l
2
1
)
Factor
†
Factor
c
1A
l
1
c
1B
l
1
M
AB
M
BA
k
AB
k
BA
COF
AB
COF
BA
0.10
0.20
0.082
0.091
4.27
4.61
0.548
0.508
0.25
0.080
0.095
4.34
4.93
0.573
0.504
0.30
0.078
0.100
4.41
5.34
0.602
0.498
0.35
0.075
0.105
4.50
5.85
0.637
0.491
0.15
0.086
0.086
4.40
4.40
0.526
0.526
0.20
0.084
0.090
4.46
4.65
0.546
0.523
0.15
0.25
0.083
0.094
4.53
4.98
0.571
0.519
0.30
0.080
0.099
4.61
5.40
0.601
0.513
0.35
0.078
0.104
4.70
5.92
0.635
0.505
0.20
0.088
0.088
4.72
4.72
0.543
0.543
0.20
0.25
0.086
0.092
4.79
5.05
0.568
0.539
0.30
0.083
0.097
4.88
5.48
0.597
0.532
0.35
0.081
0.102
4.99
6.01
0.632
0.524
0.25
0.090
0.090
5.14
5.14
0.563
0.563
0.25
0.30
0.088
0.095
5.24
5.58
0.592
0.556
0.35
0.085
0.100
5.36
6.12
0.626
0.548
0.30
0.30
0.092
0.092
5.69
5.69
0.585
0.585
0.35
0.090
0.097
5.83
6.26
0.619
0.576
0.35
0.35
0.095
0.095
6.42
6.42
0.609
0.609
a
Applicable when c
1
/l
1
= c
2
/l
2
. For other relationships between these ratios, the constants will be slightly in error.
†
Stiffness is K
AB
= k
AB
E
(l
2
h
3
/12l
1
) and K
BA
= k
BA
E
(l
2
h
3
/12l
1
)
McCormac
b01.tex
V2 - January 10, 2013
5:36 P.M.
Page 650
650
A P P E N D I X A
Tables and Graphs: U.S. Customary Units
T ABLE A.17
Moment Distribution Constants for Slabs with Drop Panels
a
c
1A
A
B
w
h
1.25h
C
L
C
L
`
1
⎜6
2
`
1
⎜3
`
1
⎜6
c
1B
Column
Uniform Load
Stiffness
Carryover
Dimension
FEM
= Coef. (wl
2
l
2
1
)
Factor
†
Factor
c
1A
l
1
c
1B
l
1
M
AB
M
BA
k
AB
k
BA
COF
AB
COF
BA
0.00
0.088
0.088
4.78
4.78
0.541
0.541
0.05
0.087
0.089
4.80
4.82
0.545
0.541
0.10
0.087
0.090
4.83
4.94
0.553
0.541
0.00
0.15
0.085
0.093
4.87
5.12
0.567
0.540
0.20
0.084
0.096
4.93
5.36
0.585
0.537
0.25
0.082
0.100
5.00
5.68
0.606
0.534
0.30
0.080
0.105
5.09
6.07
0.631
0.529
0.05
0.088
0.088
4.84
4.84
0.545
0.545
0.10
0.087
0.090
4.87
4.95
0.553
0.544
0.15
0.085
0.093
4.91
5.13
0.567
0.543
0.05
0.20
0.084
0.096
4.97
5.38
0.584
0.541
0.25
0.082
0.100
5.05
5.70
0.606
0.537
0.30
0.080
0.104
5.13
6.09
0.632
0.532
0.10
0.089
0.089
4.98
4.98
0.553
0.553
0.15
0.088
0.092
5.03
5.16
0.566
0.551
0.10
0.20
0.086
0.094
5.09
5.42
0.584
0.549
0.25
0.084
0.099
5.17
5.74
0.606
0.546
0.30
0.082
0.103
5.26
6.13
0.631
0.541
0.15
0.090
0.090
5.22
5.22
0.565
0.565
0.20
0.089
0.094
5.28
5.47
0.583
0.563
0.15
0.25
0.087
0.097
5.37
5.80
0.604
0.559
0.30
0.085
0.102
5.46
6.21
0.630
0.554
0.20
0.092
0.092
5.55
5.55
0.580
0.580
0.20
0.25
0.090
0.096
5.64
5.88
0.602
0.577
0.30
0.088
0.100
5.74
6.30
0.627
0.571
0.25
0.25
0.094
0.094
5.98
5.98
0.598
0.598
0.30
0.091
0.098
6.10
6.41
0.622
0.593
0.30
0.30
0.095
0.095
6.54
6.54
0.617
0.617
a
Applicable when c
1
/l
1
= c
2
/l
2
. For other relationships between these ratios, the constants will be slightly in error.
†
Stiffness is K
AB
= k
AB
E
(l
2
h
3
/12l
1
) and K
BA
= k
BA
E
(l
2
h
3
/12l
1
)
McCormac
b01.tex
V2 - January 10, 2013
5:36 P.M.
Page 651
A P P E N D I X A
Tables and Graphs: U.S. Customary Units
651
T ABLE A.18
Moment Distribution Constants for Slab-Beam Members with Column Capitals
FEM (uniform load w) = Mw
`
2
(
`
1
)
2
w
h
h
c
1
c
1
c
2
Carryover factor = C
`
2
K (stiffness)
= kE
`
2
h
3
12
`
1
c
1
l
1
c
1
l
2
M
k
C
c
1
l
1
c
1
l
2
M
k
C
0.00
0.083
4.000
0.500
0.10
0.25
0.087
4.449
0.530
0.05
0.083
4.000
0.500
0.30
0.087
4.535
0.535
0.10
0.083
4.000
0.500
0.35
0.088
4.618
0.540
0.15
0.083
4.000
0.500
0.40
0.088
4.698
0.545
0.20
0.083
4.000
0.500
0.45
0.089
4.774
0.550
0.00
0.25
0.083
4.000
0.500
0.50
0.089
4.846
0.554
0.30
0.083
4.000
0.500
0.00
0.083
4.000
0.500
0.35
0.083
4.000
0.500
0.05
0.084
4.132
0.509
0.40
0.083
4.000
0.500
0.10
0.085
4.267
0.517
0.45
0.083
4.000
0.500
0.15
0.086
4.403
0.526
0.50
0.083
4.000
0.500
0.20
0.087
4.541
0.534
0.00
0.083
4.000
0.500
0.15
0.25
0.088
4.680
0.543
0.05
0.084
4.047
0.503
0.30
0.089
4.818
0.550
0.10
0.084
4.093
0.507
0.00
0.083
4.000
0.500
0.15
0.084
4.138
0.510
0.05
0.085
4.170
0.511
0.20
0.085
4.181
0.513
0.10
0.086
4.346
0.522
0.05
0.25
0.085
4.222
0.516
0.15
0.087
4.529
0.532
0.30
0.085
4.261
0.518
0.20
0.088
4.717
0.543
0.35
0.086
4.299
0.521
0.20
0.25
0.089
4.910
0.554
0.40
0.086
4.334
0.523
0.30
0.090
5.108
0.564
0.45
0.086
4.368
0.526
0.35
0.091
5.308
0.574
0.50
0.086
4.398
0.528
0.40
0.092
5.509
0.584
0.00
0.083
4.000
0.500
0.45
0.093
5.710
0.593
0.05
0.084
4.091
0.506
0.50
0.094
5.908
0.602
0.10
0.085
4.182
0.513
0.00
0.083
4.000
0.500
0.15
0.085
4.272
0.519
0.05
0.085
4.204
0.512
0.20
0.086
4.362
0.524
0.10
0.086
4.420
0.525
(continues)
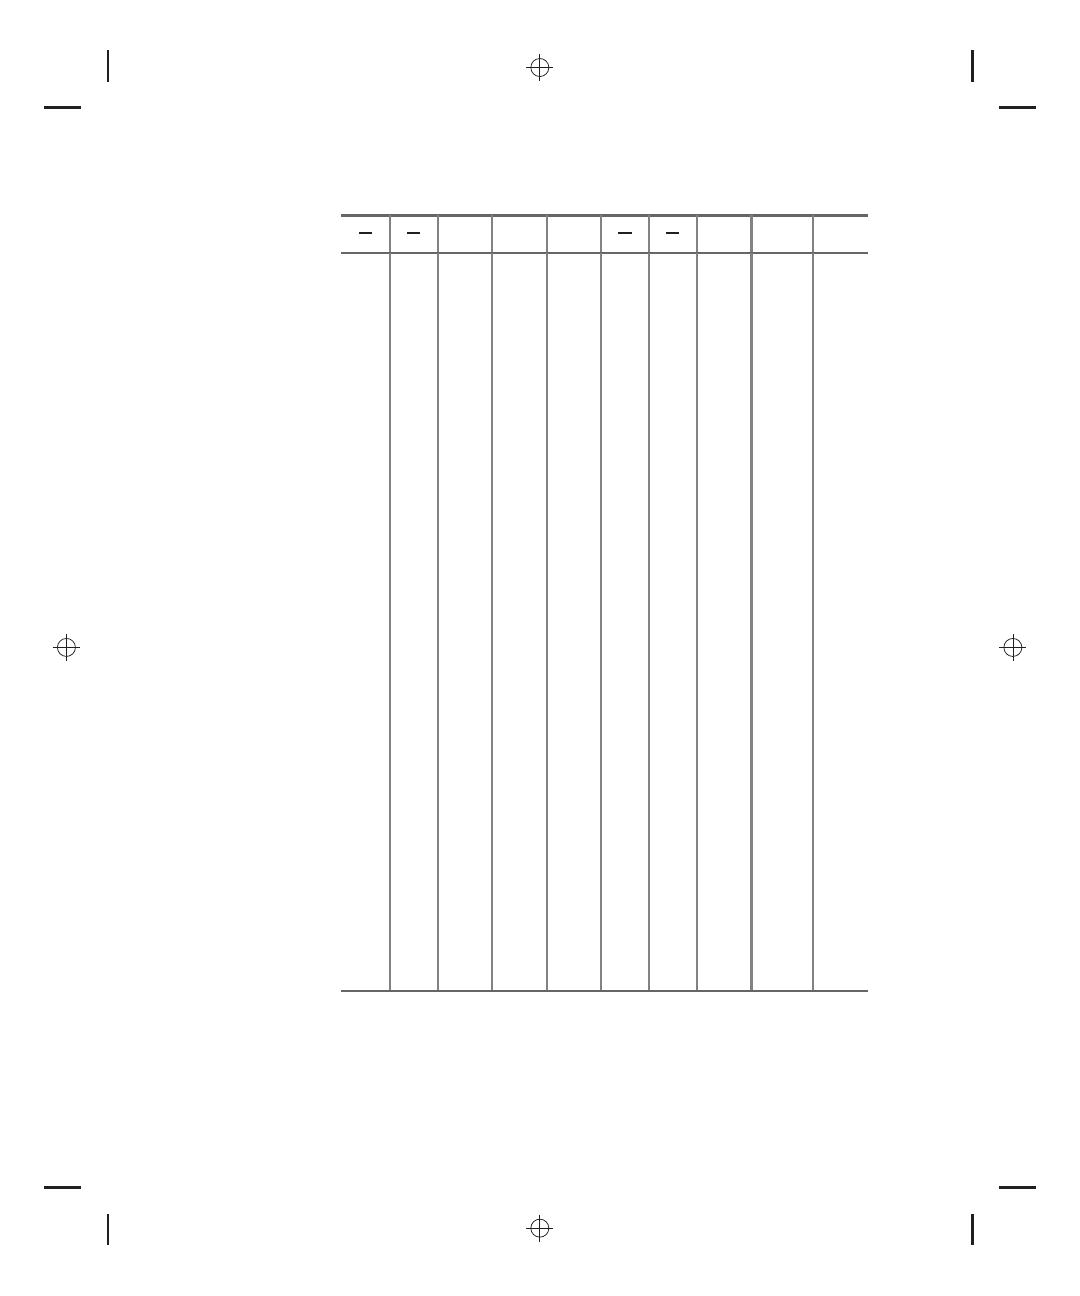
McCormac
b01.tex
V2 - January 10, 2013
5:36 P.M.
Page 652
652
A P P E N D I X A
Tables and Graphs: U.S. Customary Units
T ABLE A.18
(Continued)
c
1
l
1
c
1
l
2
M
k
C
c
1
l
1
c
1
l
2
M
k
C
0.15
0.087
4.648
0.538
0.20
0.090
5.348
0.563
0.20
0.089
4.887
0.550
0.40
0.25
0.092
5.778
0.580
0.25
0.25
0.090
5.138
0.563
0.30
0.094
6.255
0.598
0.30
0.091
5.401
0.576
0.35
0.095
6.782
0.617
0.35
0.093
5.672
0.588
0.40
0.097
7.365
0.635
0.40
0.094
5.952
0.600
0.45
0.099
8.007
0.654
0.45
0.095
6.238
0.612
0.50
0.100
8.710
0.672
0.50
0.096
6.527
0.623
0.00
0.083
4.000
0.500
0.00
0.083
4.000
0.500
0.05
0.085
4.311
0.515
0.05
0.085
4.235
0.514
0.10
0.087
4.658
0.530
0.10
0.086
4.488
0.527
0.15
0.088
5.046
0.547
0.15
0.088
4.760
0.542
0.20
0.090
5.480
0.564
0.20
0.089
5.050
0.556
0.45
0.25
0.092
5.967
0.583
0.30
0.25
0.091
5.361
0.571
0.35
0.095
6.416
0.609
0.30
0.092
5.692
0.585
0.40
0.096
6.888
0.626
0.35
0.094
6.044
0.600
0.45
0.098
7.395
0.642
0.40
0.095
6.414
0.614
0.50
0.099
7.935
0.658
0.45
0.096
6.802
0.628
0.30
0.094
6.517
0.602
0.50
0.098
7.205
0.642
0.35
0.096
7.136
0.621
0.00
0.083
4.000
0.500
0.40
0.098
7.836
0.642
0.05
0.085
4.264
0.514
0.45
0.100
8.625
0.662
0.10
0.087
4.551
0.529
0.50
0.101
9.514
0.683
0.15
0.088
4.864
0.545
0.00
0.083
4.000
0.500
0.20
0.090
5.204
0.560
0.05
0.085
4.331
0.515
0.35
0.25
0.091
5.575
0.576
0.10
0.087
4.703
0.530
0.30
0.093
5.979
0.593
0.15
0.088
5.123
0.547
0.35
0.090
4.955
0.558
0.20
0.090
5.599
0.564
0.40
0.090
5.090
0.565
0.50
0.25
0.092
6.141
0.583
0.45
0.091
5.222
0.572
0.30
0.094
6.760
0.603
0.50
0.092
5.349
0.579
0.35
0.096
7.470
0.624
0.00
0.083
4.000
0.500
0.40
0.098
8.289
0.645
0.05
0.085
4.289
0.515
0.45
0.100
9.234
0.667
0.10
0.087
4.607
0.530
0.50
0.102
10.329
0.690
0.15
0.088
4.959
0.546
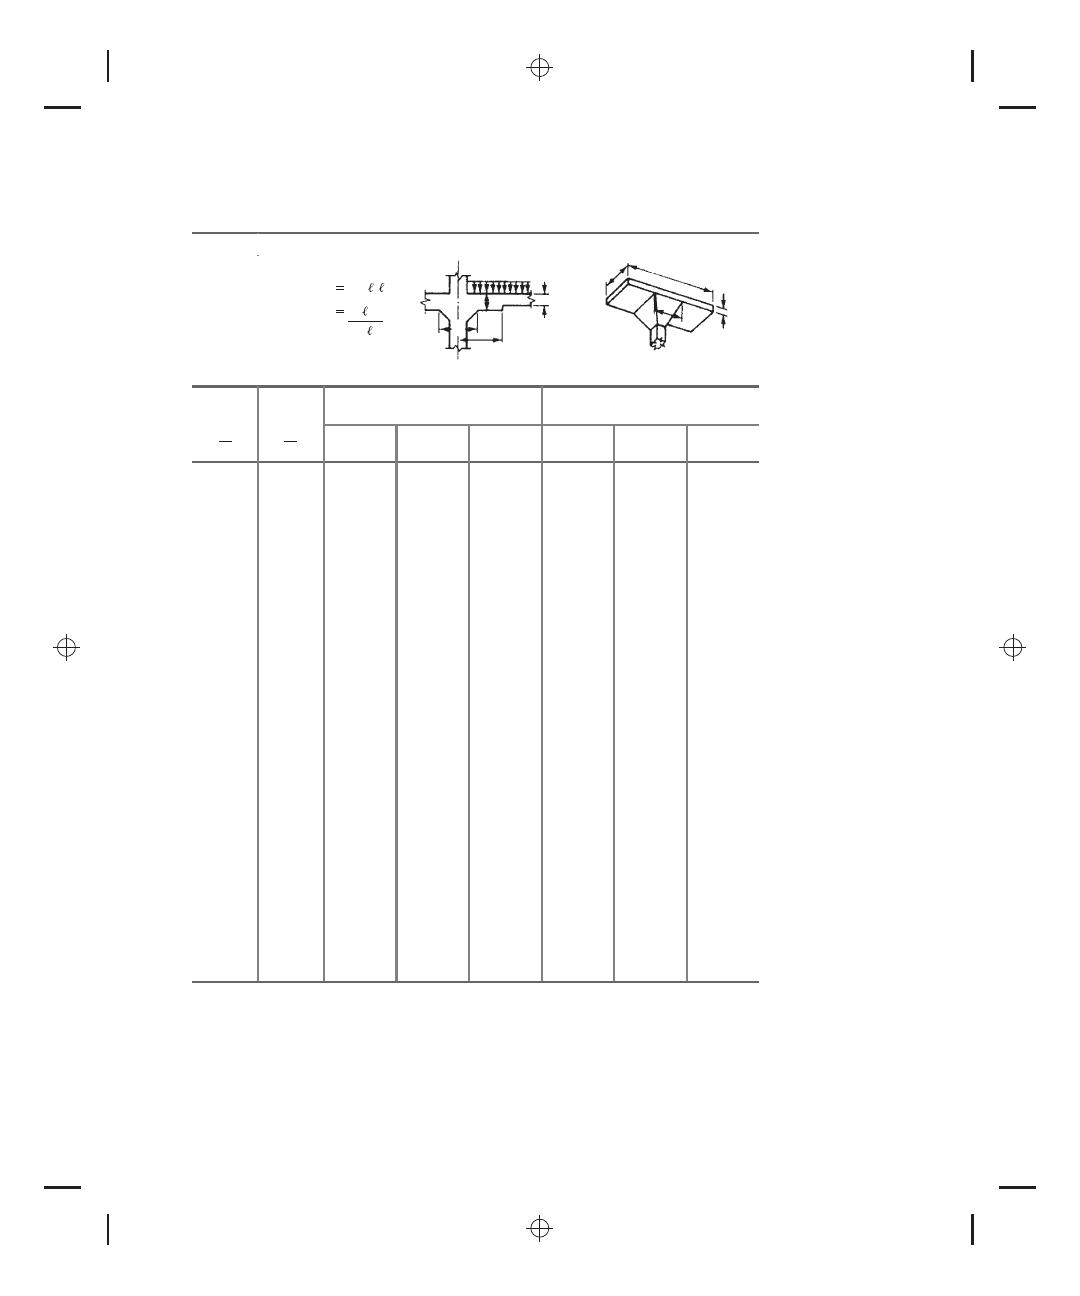
McCormac
b01.tex
V2 - January 10, 2013
5:36 P.M.
Page 653
A P P E N D I X A
Tables and Graphs: U.S. Customary Units
653
T ABLE A.19
Moment Distribution Constants for Slab-Beam Members with Column Capitals and
Drop Panels
FEM (uniform load w)
Mw (
2
1
)
K (stiffness)
kE
2
h
3
12
1
w
h
2
h
1
c
1
c
2
h
c
1
`
1
⎜
6
`
2
Constants for
Constants for
h
2
= 1.25h
1
h
2
= 1.5h
2
c
1
l
1
c
1
l
2
M
k
C
M
k
C
0.00
0.088
4.795
0.542
0.093
5.837
0.589
0.05
0.088
4.795
0.542
0.093
5.837
0.589
0.10
0.088
4.795
0.542
0.093
5.837
0.589
0.00
0.15
0.088
4.795
0.542
0.093
5.837
0.589
0.20
0.088
4.795
0.542
0.093
5.837
0.589
0.25
0.088
4.795
0.542
0.093
5.837
0.589
0.30
0.088
4.797
0.542
0.093
5.837
0.589
0.00
0.088
4.795
0.542
0.093
5.837
0.589
0.05
0.088
4.846
0.545
0.093
5.890
0.591
0.10
0.089
4.896
0.548
0.093
5.942
0.594
0.05
0.15
0.089
4.944
0.551
0.093
5.993
0.596
0.20
0.089
4.990
0.553
0.094
6.041
0.598
0.25
0.089
5.035
0.556
0.094
6.087
0.600
0.30
0.090
5.077
0.558
0.094
6.131
0.602
0.00
0.088
4.795
0.542
0.093
5.837
0.589
0.05
0.088
4.894
0.548
0.093
5.940
0.593
0.10
0.089
4.992
0.553
0.094
6.042
0.598
0.10
0.15
0.090
5.039
0.559
0.094
6.142
0.602
0.20
0.090
5.184
0.564
0.094
6.240
0.607
0.25
0.091
5.278
0.569
0.095
6.335
0.611
0.30
0.091
5.368
0.573
0.095
6.427
0.615
0.00
0.088
4.795
0.542
0.093
5.837
0.589
0.05
0.089
4.938
0.550
0.093
5.986
0.595
0.10
0.090
5.082
0.558
0.094
6.135
0.602
(continues)
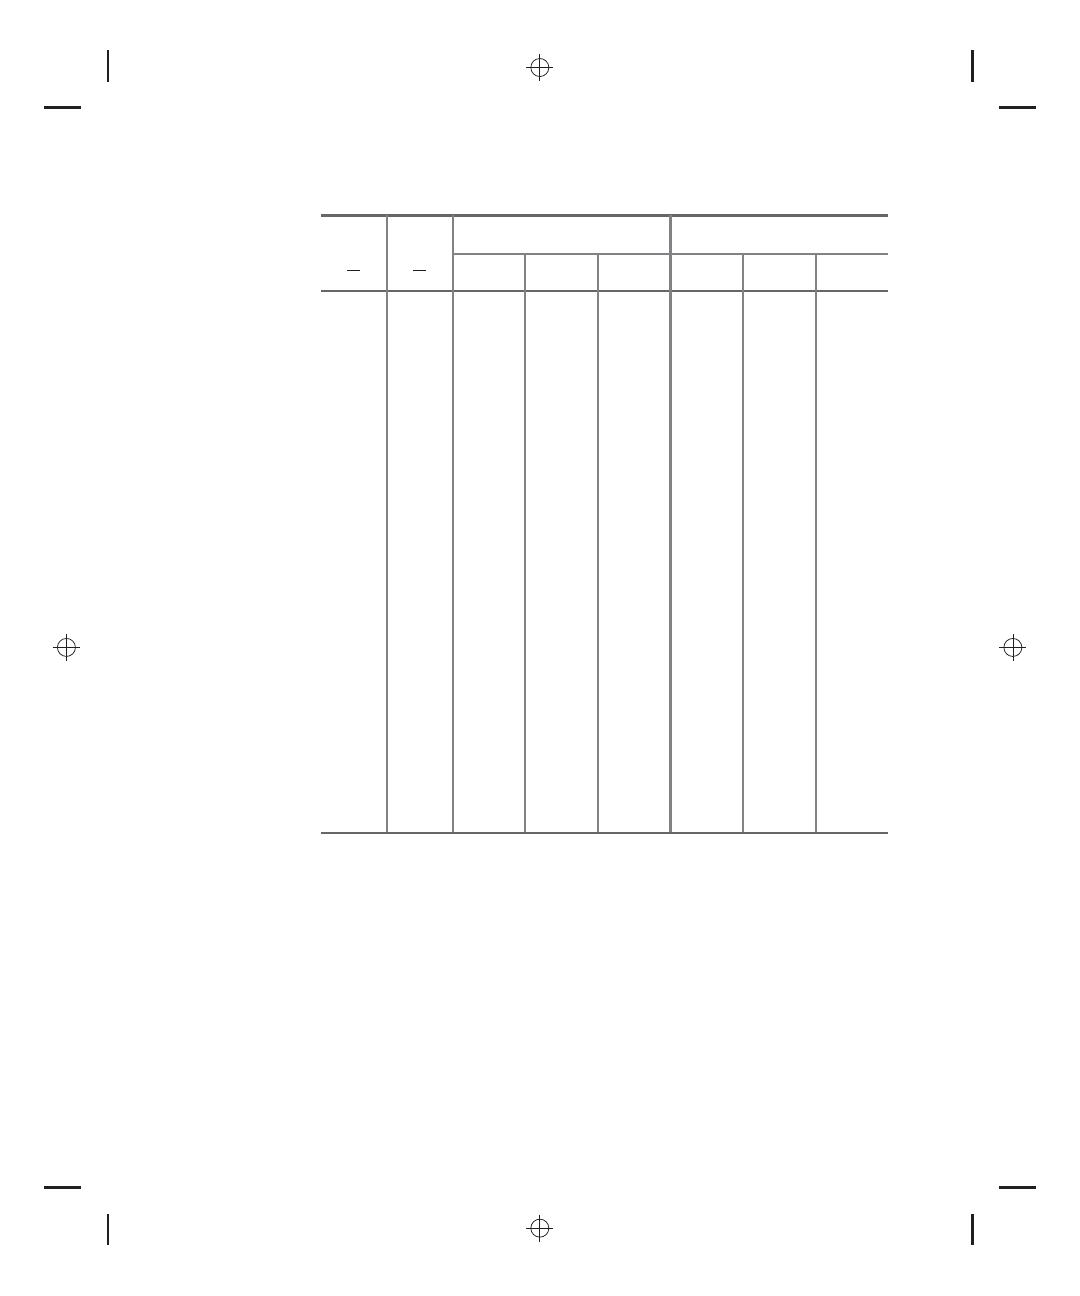
McCormac
b01.tex
V2 - January 10, 2013
5:36 P.M.
Page 654
654
A P P E N D I X A
Tables and Graphs: U.S. Customary Units
T ABLE A.19
(Continued)
Constants for
Constants for
h
2
= 1.25h
1
h
2
= 1.5h
2
c
1
l
1
c
1
l
2
M
k
C
M
k
C
0.15
0.15
0.090
5.228
0.565
0.095
6.284
0.608
0.20
0.091
5.374
0.573
0.095
6.432
0.614
0.25
0.092
5.520
0.580
0.096
6.579
0.620
0.30
0.092
5.665
0.587
0.096
6.723
0.626
0.00
0.088
4.795
0.542
0.093
5.837
0.589
0.05
0.089
4.978
0.552
0.093
6.027
0.597
0.10
0.090
5.167
0.562
0.094
6.221
0.605
0.20
0.15
0.091
5.361
0.571
0.095
6.418
0.613
0.20
0.092
5.558
0.581
0.096
6.616
0.621
0.25
0.093
5.760
0.590
0.096
6.816
0.628
0.30
0.094
5.962
0.590
0.097
7.015
0.635
0.00
0.088
4.795
0.542
0.093
5.837
0.589
0.05
0.089
5.015
0.553
0.094
6.065
0.598
0.10
0.090
5.245
0.565
0.094
6.300
0.608
0.25
0.15
0.091
5.485
0.576
0.095
6.543
0.617
0.20
0.092
5.735
0.587
0.096
6.790
0.626
0.25
0.094
5.994
0.598
0.097
7.043
0.635
0.30
0.095
6.261
0.600
0.098
7.298
0.644
0.00
0.088
4.795
0.542
0.093
5.837
0.589
0.05
0.089
5.048
0.554
0.094
6.099
0.599
0.10
0.090
5.317
0.567
0.095
6.372
0.610
0.30
0.15
0.092
5.601
0.580
0.096
6.657
0.620
0.20
0.093
5.902
0.593
0.097
6.953
0.631
0.25
0.094
6.219
0.605
0.098
7.258
0.641
0.30
0.095
6.550
0.618
0.099
7.571
0.651
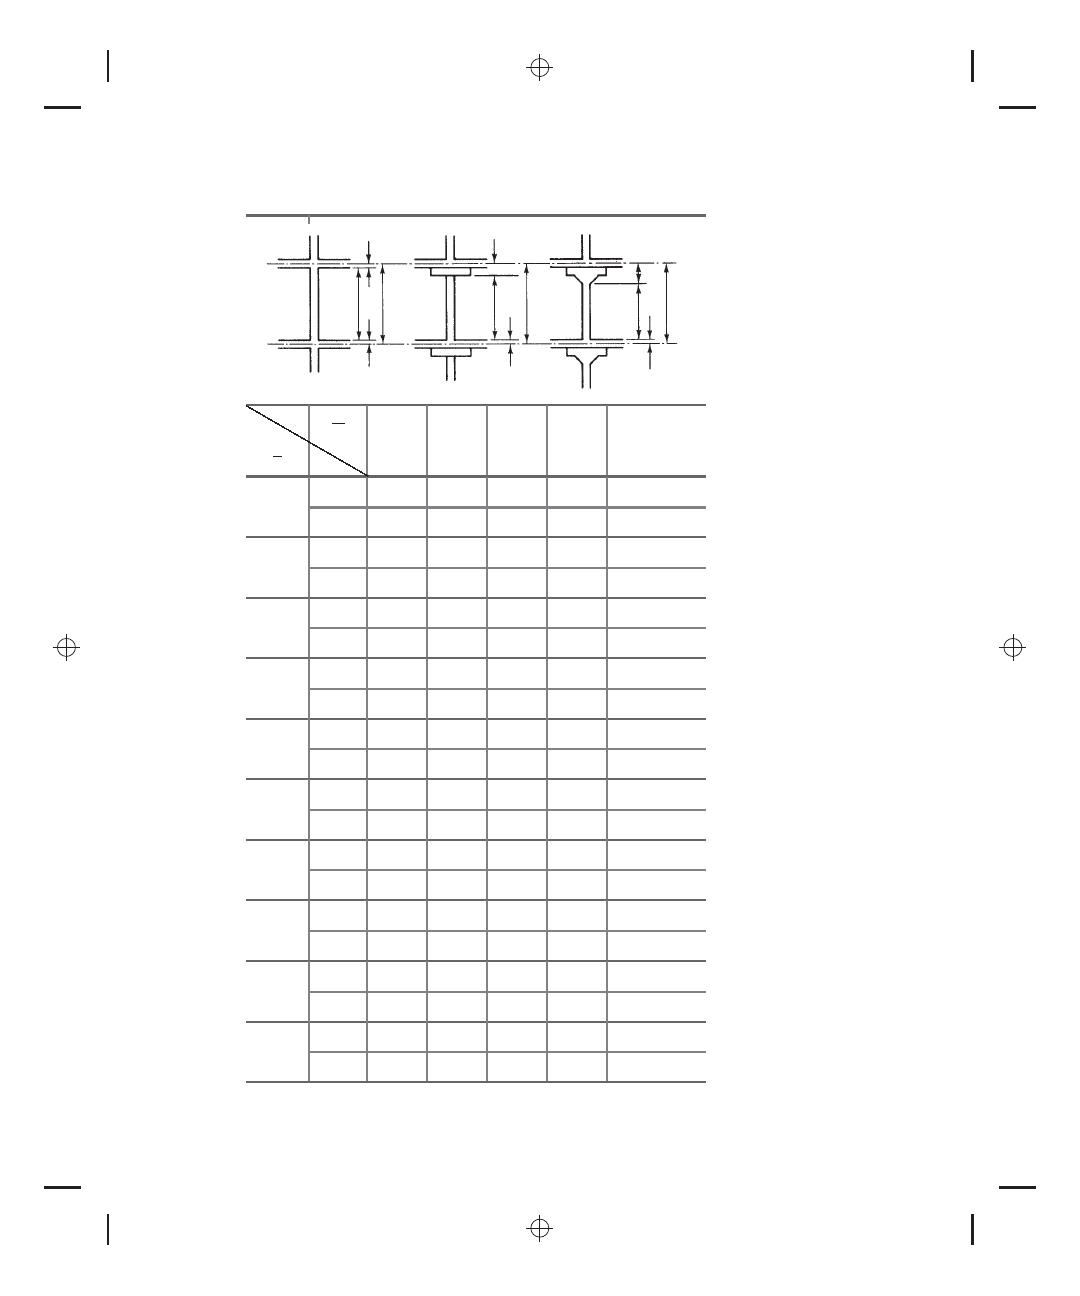
McCormac
b01.tex
V2 - January 10, 2013
5:36 P.M.
Page 655
A P P E N D I X A
Tables and Graphs: U.S. Customary Units
655
T ABLE A.20
Stiffness Factors and Carryover Factors for Columns
B
b
a
a
a
b
b
B
B
A
A
A
`
u
`
c
`
u
`
c
`
u
`
c
l
u
l
n
a
b
0.95
0.90
0.85
0.80
0.75
0.20
k
AB
4.32
4.70
5.33
5.65
6.27
C
AB
0.57
0.64
0.71
0.80
0.89
0.40
k
AB
4.40
4.89
5.45
6.15
7.00
C
AB
0.56
0.61
0.68
0.74
0.81
0.60
k
AB
4.46
5.02
5.70
6.54
7.58
C
AB
0.55
0.60
0.65
0.70
0.76
0.80
k
AB
4.51
5.14
5.90
6.85
8.05
C
AB
0.54
0.58
0.63
0.67
0.72
1.00
k
AB
4.55
5.23
6.06
7.11
8.44
C
AB
0.54
0.57
0.61
0.65
0.68
1.20
k
AB
4.58
5.30
6.20
7.32
8.77
C
AB
0.53
0.57
0.60
0.63
0.66
1.40
k
AB
4.61
5.36
6.31
7.51
9.05
C
AB
0.53
0.56
0.59
0.61
0.64
1.60
k
AB
4.63
5.42
6.41
7.66
9.29
C
AB
0.53
0.55
0.58
0.60
0.62
1.80
k
AB
4.65
5.46
6.49
7.80
9.50
C
AB
0.53
0.55
0.57
0.59
0.60
2.00
k
AB
4.67
5.51
6.56
7.92
9.68
C
AB
0.52
0.54
0.56
0.58
0.59
Notes:
1. Values computed by column analogy method.
2. k
c
= k
AB
from table
EI
0
/l
n
.
