ELECTRO-CARDIOGRAPHY (ECG)
Introduction:
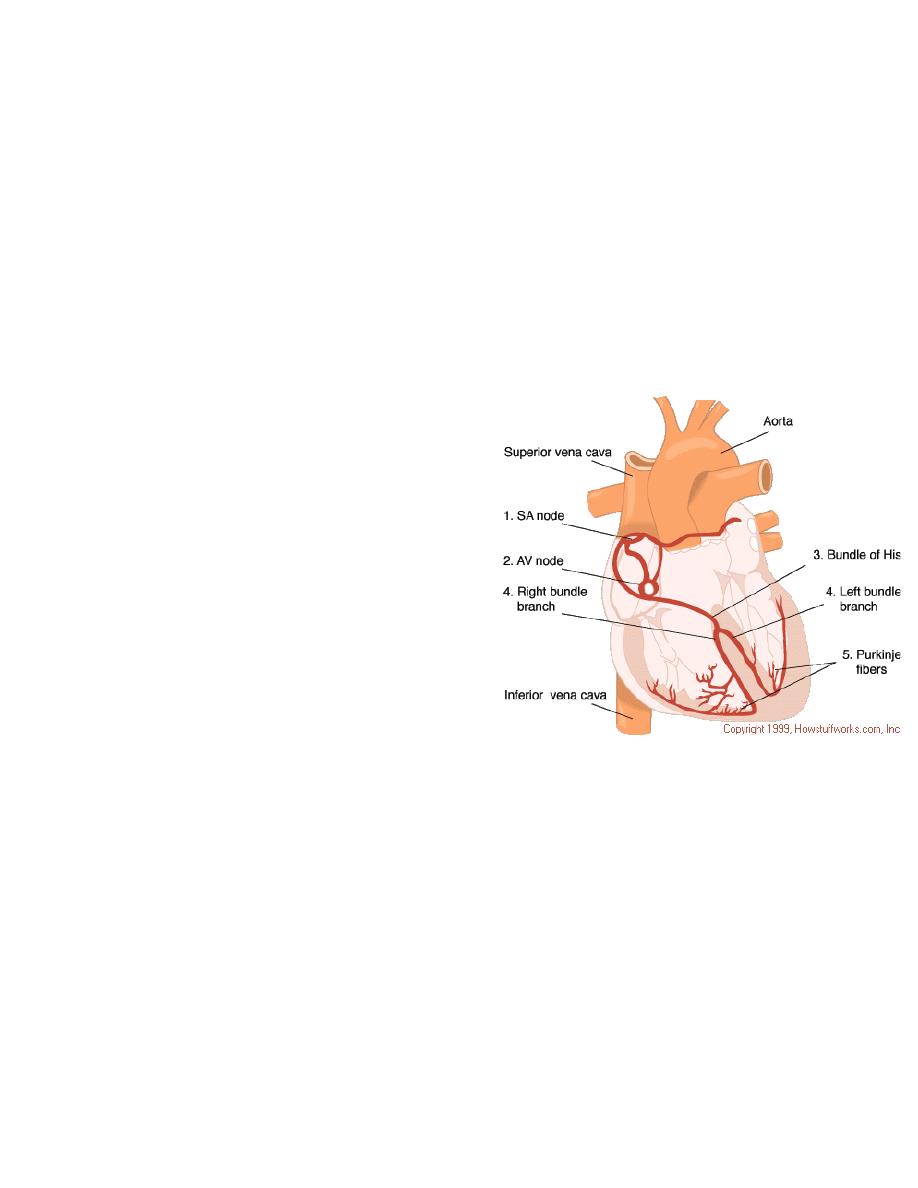
- In the human, the heartbeat is regulated by the sinoatrial (SA) node, located in
the wall of the right atrium.
- After electrical activity spread to the atrial musculature, it is conducted to the
ventricular musculature via specialized conducting pathways, including the
- Atrioventricular (AV) node,
- The bundle of His,
- The right and left bundle branches
- Purkinje fibers
-When depolarization reaches cardiac muscle Contraction (Called: Systole)
Followed by Repolarization ---------------------- Relaxation (Called diastole)
Thus, the rhythmic change in electrical activity leads to the mechanical pumping
action of the heart.
- The electric field generated by the electrical activity of the heart can be
recorded anywhere on the body surface by ECG.
ECG
- Electrocardiograph is the instrument that monitors electrical activity of the
heart.
- Used to: - Identify abnormal electrical conduction
- Estimation of heart rate
- The record produced by the electrocardiograph is called an electrocardiogram
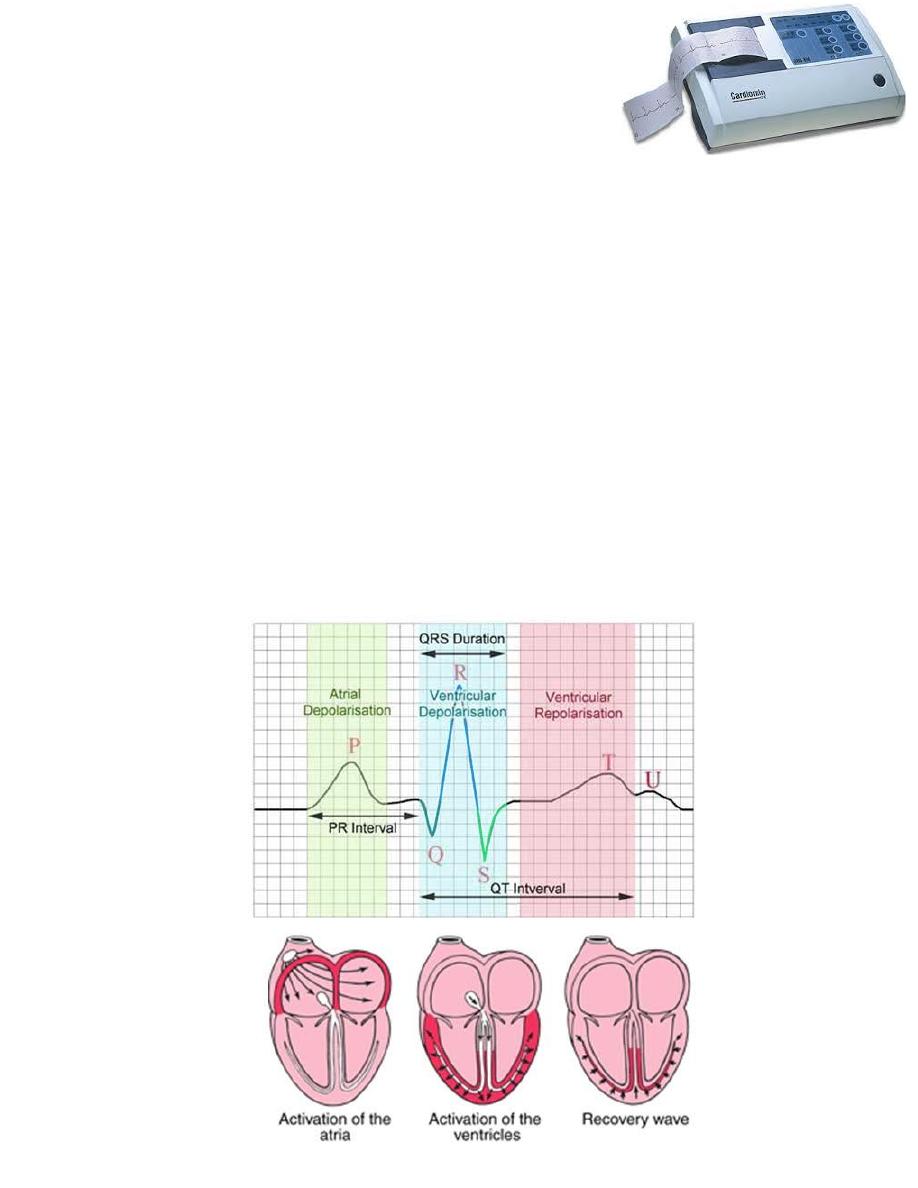
- The major components of electrocardiogram are:
- P wave atrial depolarization: spread of excitation from the SA node
over the atrial musculature
- QRS wave rapid ventricular depolarization of the heart muscle that
immediately precedes ventricular systole
- T wave ventricular repolarization of the muscle that occurs just before
ventricular diastole
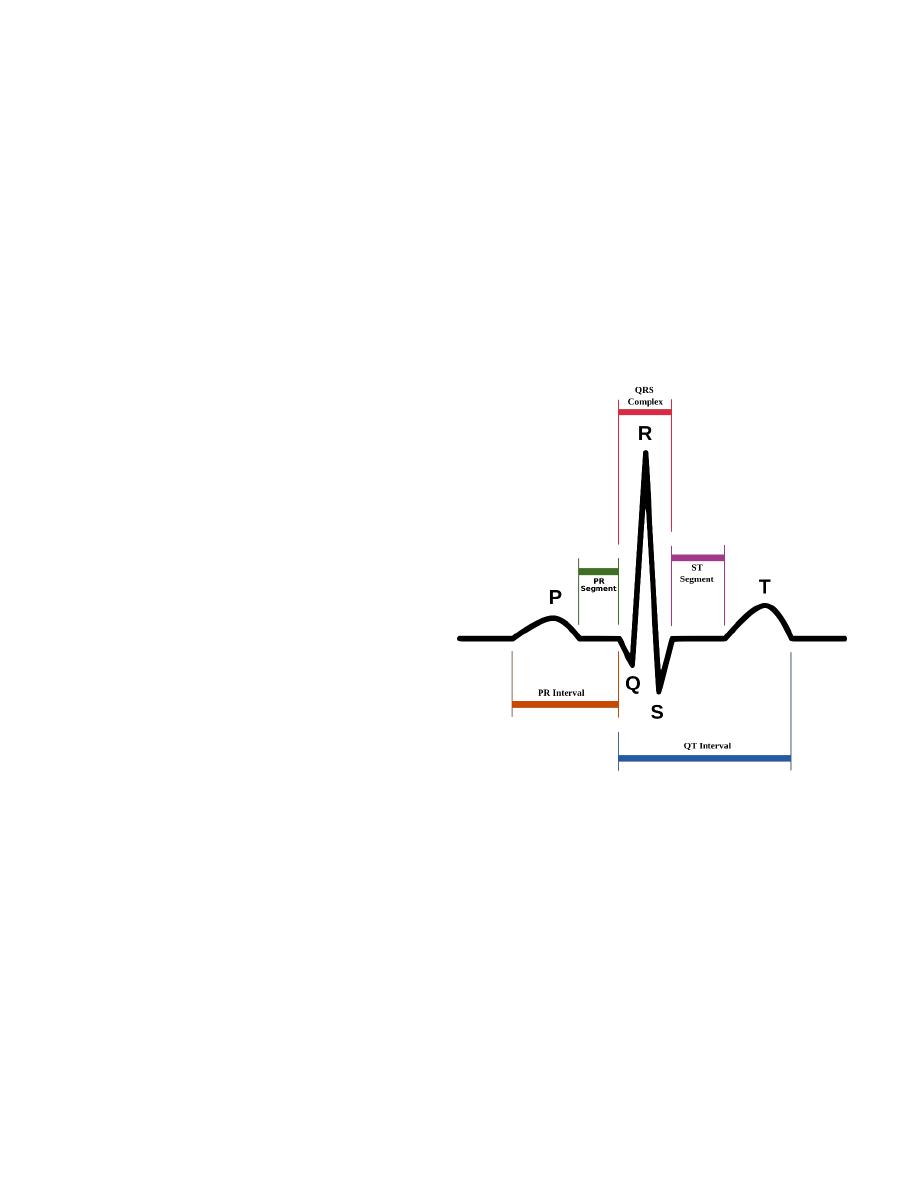
Intervals and segments
Intervals or segments: The time spans between waves
- P-R interval the time required for the action potential to travel
through the atria, AV node and other fibers of the conductive system
- S-T segment the time when the ventricular contractile fibers are depolarized
during the plateau phase of the action potential
- Q-T interval the time from the beginning of ventricular depolarization to
the end of ventricular repolarization
- According to the above,
- Atrial contraction (or systole) is developed during the peak of the P wave and
lasts until the onset of the Q wave,
- Ventricular systole takes place between the onsets of the QRS complex until
the peak of the T wave.
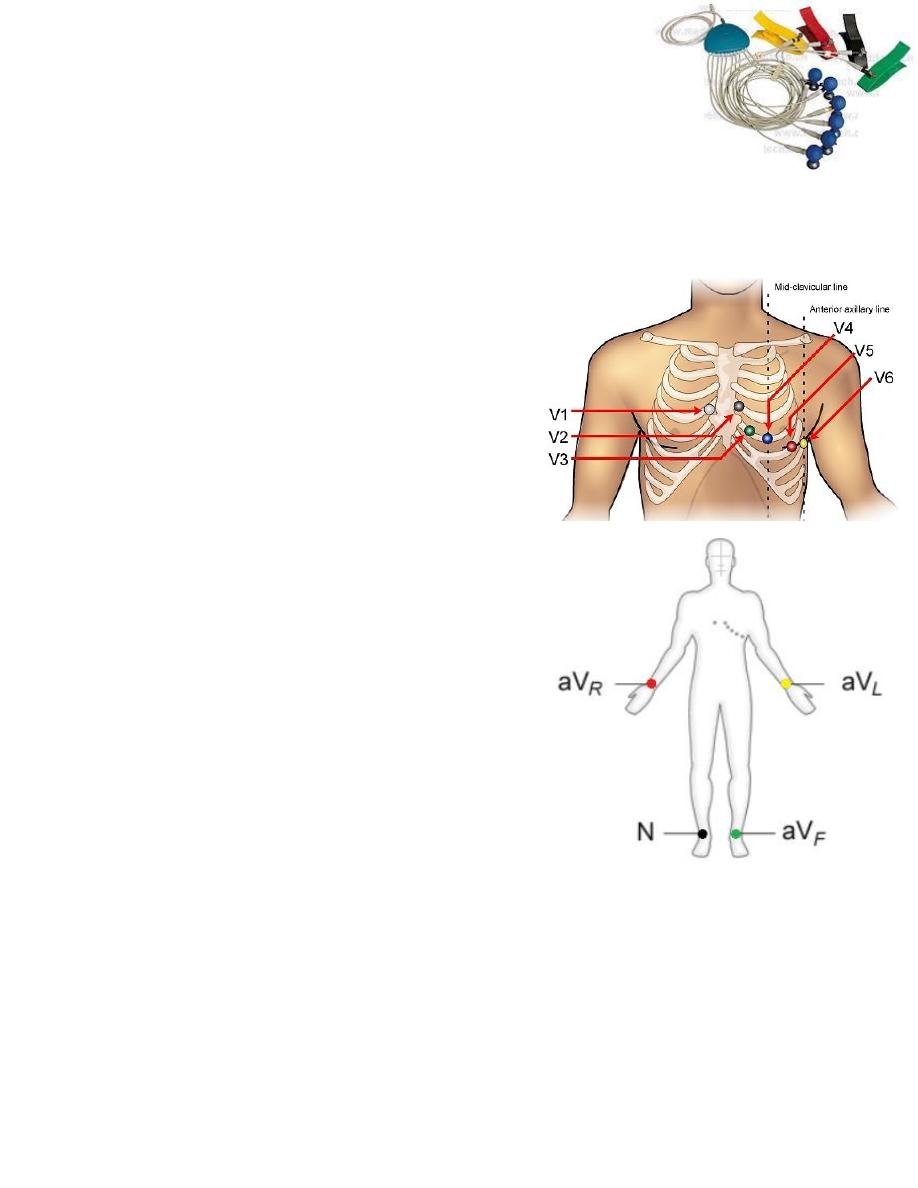
Procedure
In clinical ECG practice, electrodes are positioned on the arms and legs (4 limb
leads) and at six positions on the chest (6 chest leads).
Positions of the leads
Chest leads
-
V1
: 4
th
intercostal space (right of sternum)
-
V2
: 4
th
intercostal space (left of sternum)
-
V3
: directly between V2 and V4
-
V4
: 5
th
intercostal space at midclavicular line
-
V5
: Level with V4 at left anterior axillary line
- V6: Level with V5 at left midaxillary line
(Directly under the midpoint of the armpit)
Limb leads
- aV
R
: Right wrist (Red)
- aV
L
: Left wrist (Yellow)
- N: Right foot (Black)
- aV
F
: Left arm (Green)
Potential difference is measured between pairs of electrodes that are connected
to either the negative or the positive input of a differential amplifier, as shown in
the following figure.
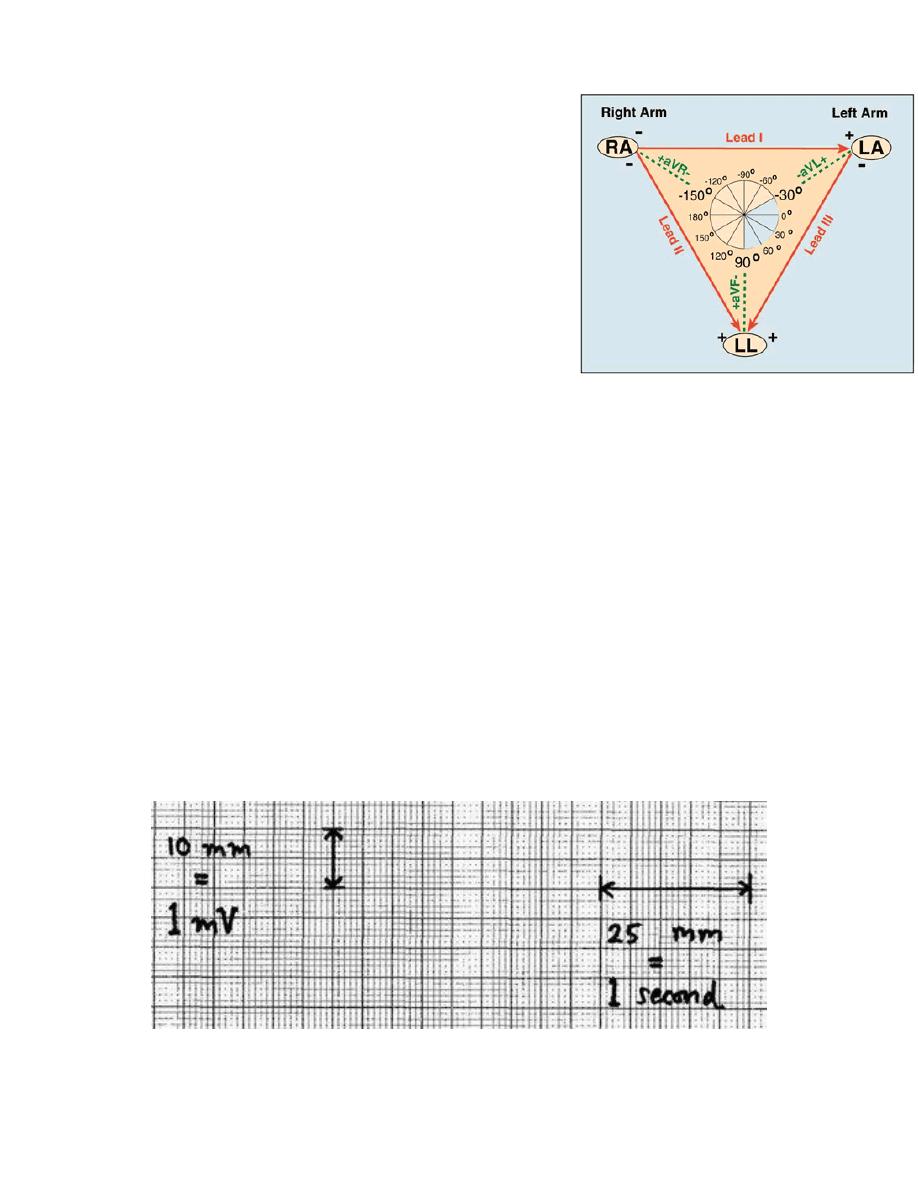
3 leads electrical directions will be produced
according to the positions of the above leads:
Lead I has the negative electrode on the right wrist
and the positive electrode on the left wrist
Lead II has a negative electrode on the right wrist
and a positive on the left ankle
Lead III measures electrical activity between the left
wrist (negative electrode) and the left ankle (positive
electrode).
Measuring and reading the results
The amplitude, or voltage, of the recorded electrical signal is expressed on an ECG
in the vertical dimension and is measured in millivolts (mV).
On standard ECG paper 1mV is represented by a deflection of 10 mm, and a speed
of 25 mm per second
ECG paper is marked with a grid of small and large squares.
Each small square represents 40 milliseconds (ms) in time along the horizontal
axis and each larger square contains 5 small squares, thus representing 200 ms,
(5 large squares = 1 second each 30 large squares= 6 seconds)
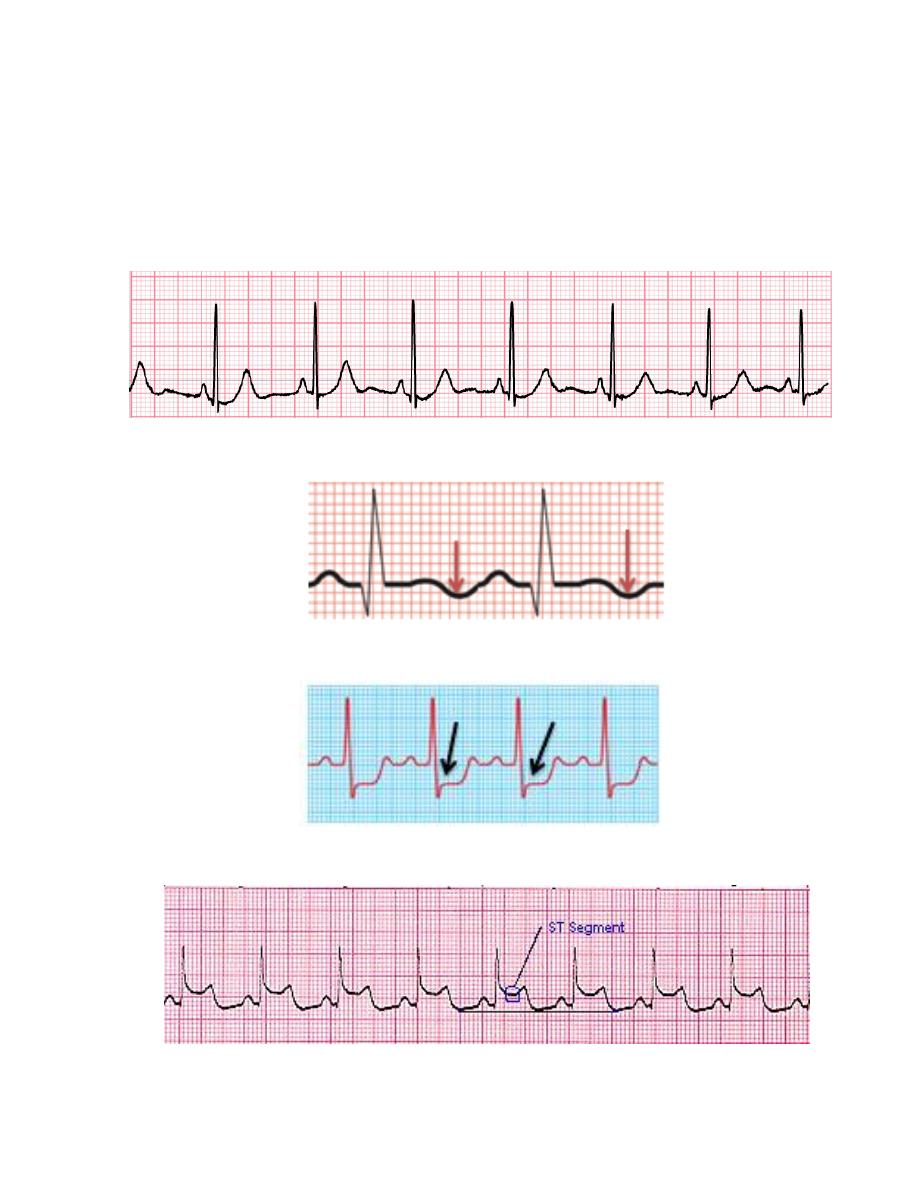
Figure: Example of T wave
inversion in unstable angina
Figure: Example of ST
segment depression in
unstable angina
Readings the results
1- Identify abnormal electrical condition (Indication of ischemic heart
disease)
- Regular shape of the peaks and regular intervals Normal sinus rhythms:
-
T wave inversion angina (as shown in figure)
- ST segment depression angina (as shown in figure)
- ST segment elevation myocardial infraction (MI)
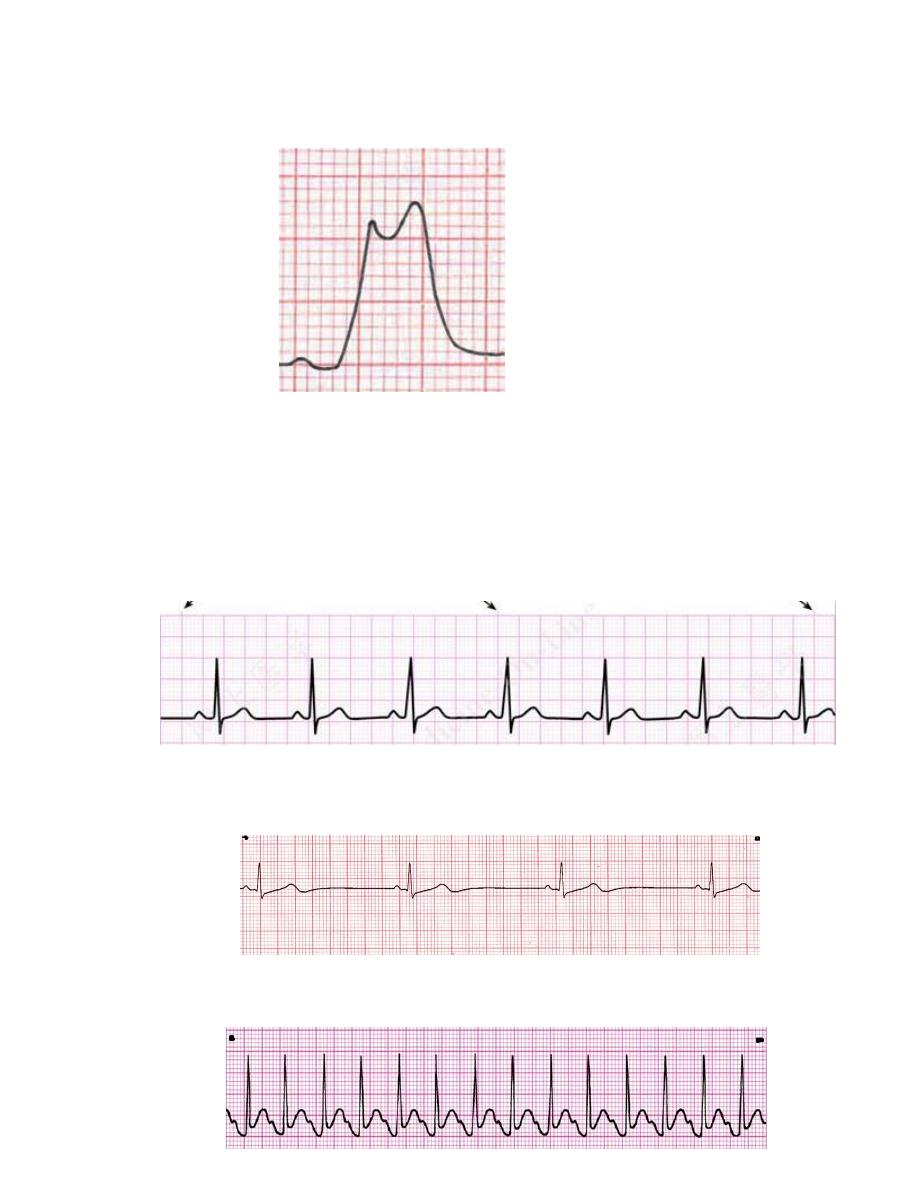
Figure: Example of QRS
complex widening in acute MI
- Wide QRS complex myocardial infraction (MI)
2. Estimation of Heart rate
As shown before, each 30 large square = 6 seconds
Thus, Heart rate (beat/min) = No. of QRS complex in 30 large squares × 10
Example 1: Heart rate= 7 QRS complex × 10 = 70 beats/min Normal
Example 2: Heart rate = 4 QRS complex × 10 = 40 beats/min Bradycardia
Example 3: Heart rate = 14 QRS complex × 10 = 140 beats/min Tachycardia
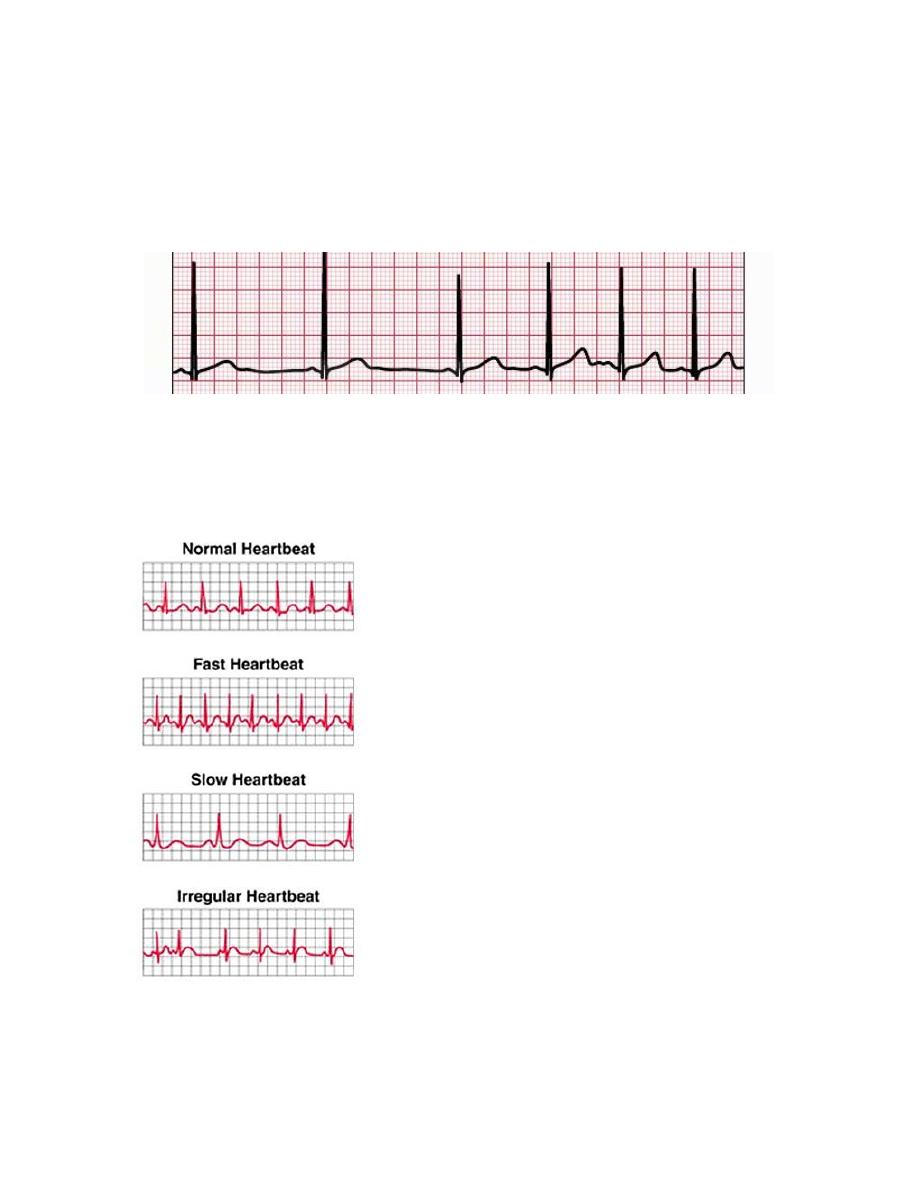
Figure: Sinus arrhythmia
Figure: This figure shows normal, fast, slow and irregular
heart beats taken by an ECG machine.
Note: Irregular heartbeats can be also identified by ECG, which can be shown as
irregular QRS complex distribution along the ECG paper.
Example: as shown in the figure below which is a case of sinus arrhythmia