Electro Cardio Graphy(ECG)
DR. ALI ALIBRAHIMIM.B.Ch.B
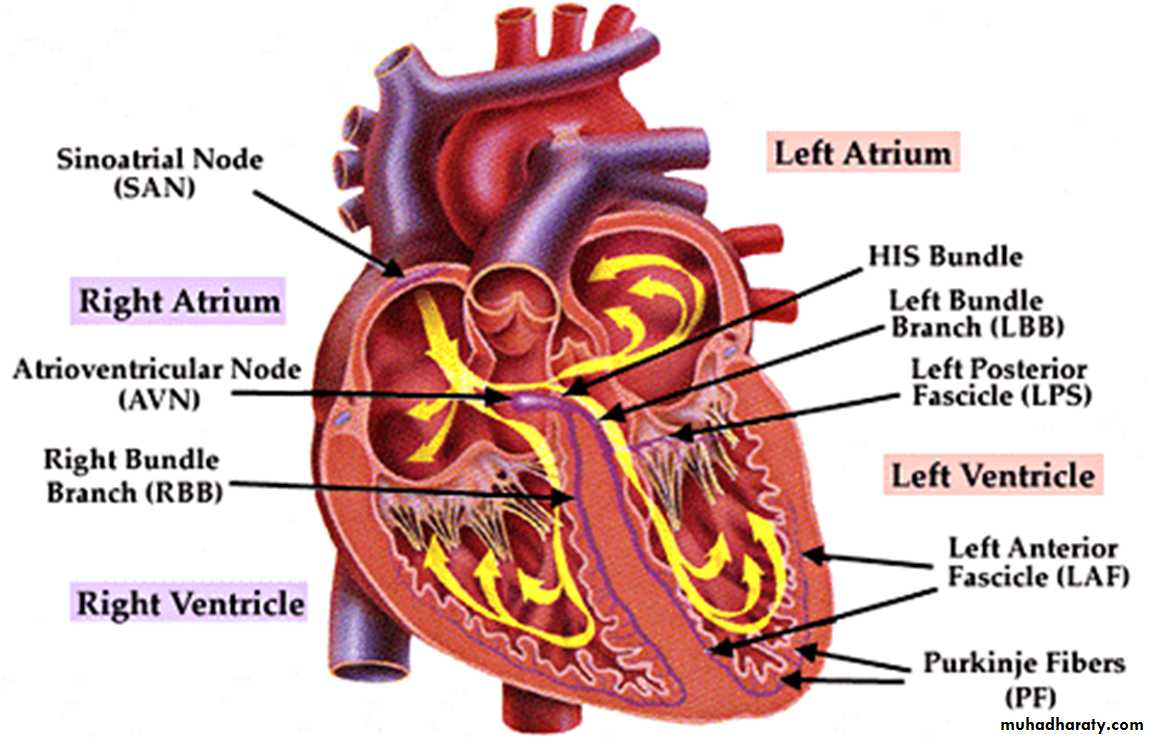
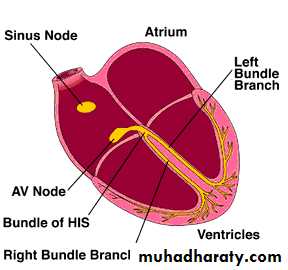
CONDUCTIVE SYSTEM
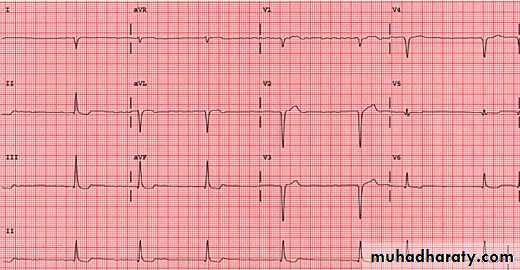
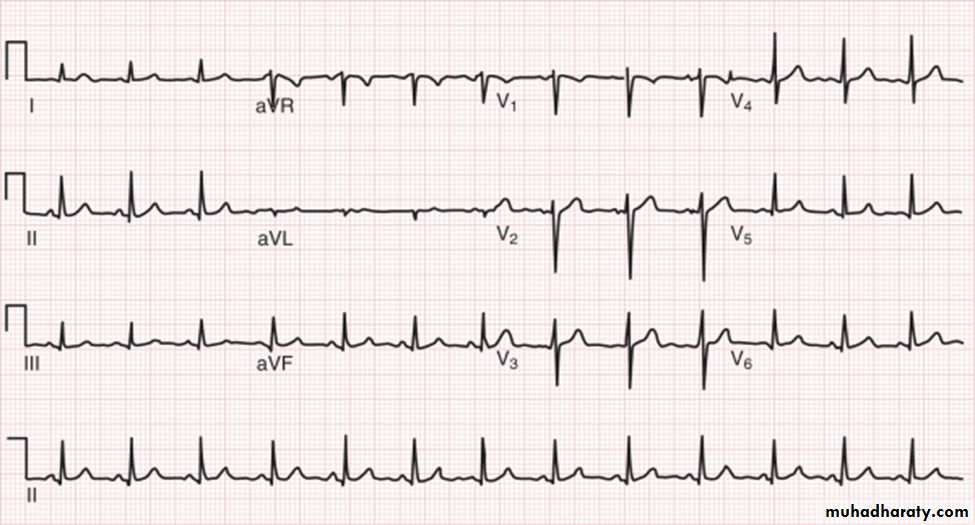
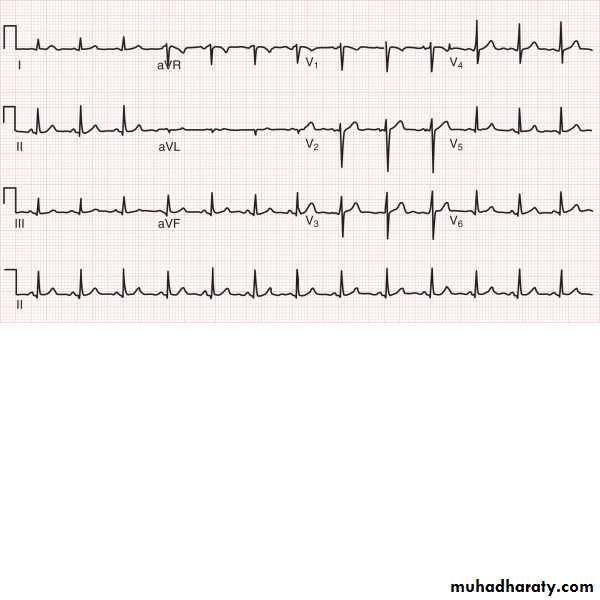
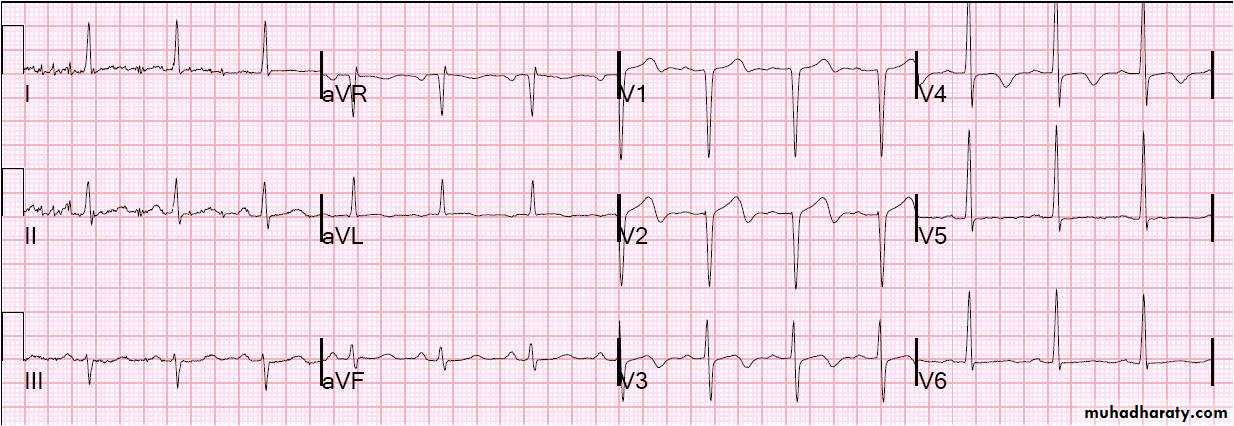
Electrode placement in 12 lead ECG
Limb leads (coronal leads): I, II, III, aVR, aVL, aVF, Chest leads: V1-V6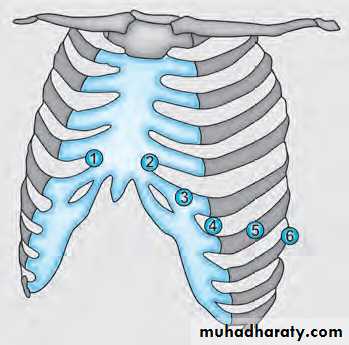
Electrodes around the heart
Electrodes placement around the heartAnterior surface: V1-4.
Inferior surface: II, III and aVF.
Lateral surface: I, aVL and V5-6
Electrode: point of connection between the body and the lead
Leads look at the heart fromdifferent directions: each lead represent the cardiac beat in a specific shape of the wave according to its location.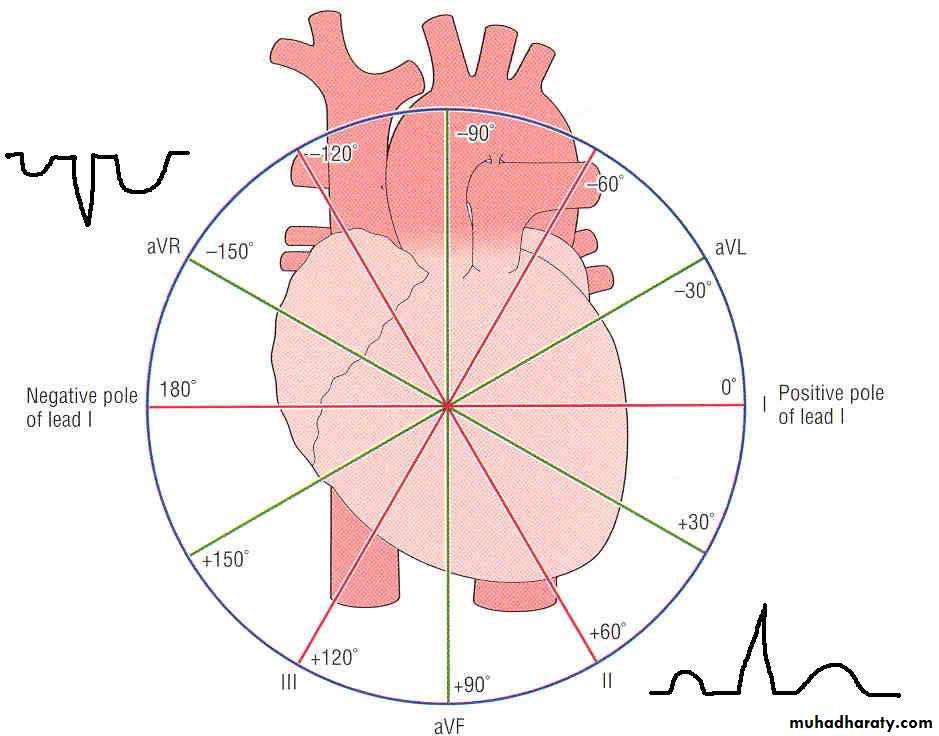
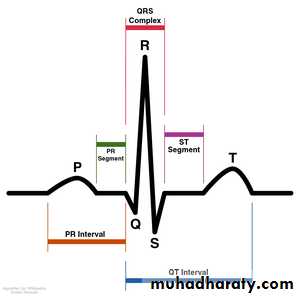
Elements of ECG wave
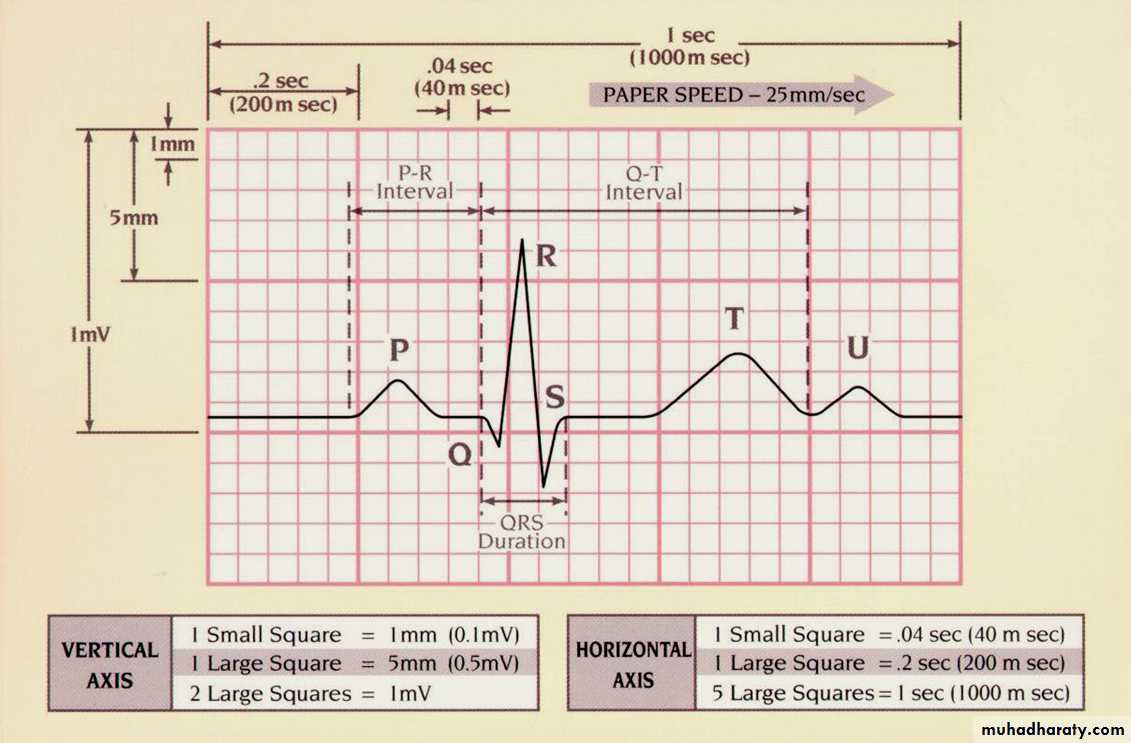
ECG paper
What do the elementsrepresent
P wave = atrial depolarisationQRS = ventricular depolarisation
T = repolarisation of the ventriclesOur objectives are :
1- interpretation of the waves2- rate
3- rhythm
4- axis
5- common clinical abnormalities
IInterpretation of waves(wave dimensions)
P waveHeight < 3 ss
Width < 2 ss ( 0.08 sec)
PR interval : The PR interval is measured between the
start of the P wave to the start of the QRS
The PR interval corresponds to the time
period between depolarisation of the atria
and ventricular depolarisation.
Normally its 3-5 ss (0.12-0.2 sec)
Prolonged PR occurs in case of heart block
Short PR interval occur in WPW syndrome(Wolf Parkinson White syndrome)
Short PR
Prolonged PR
Q wave
How you recognize Q wave?Are there any pathological Q waves?
A Q wave can be pathological if it is:
Deeper than 2 small squares (0.2mV) and/or
Wider than 1 small square (0.04s)
However its more pathological in the lateral leads
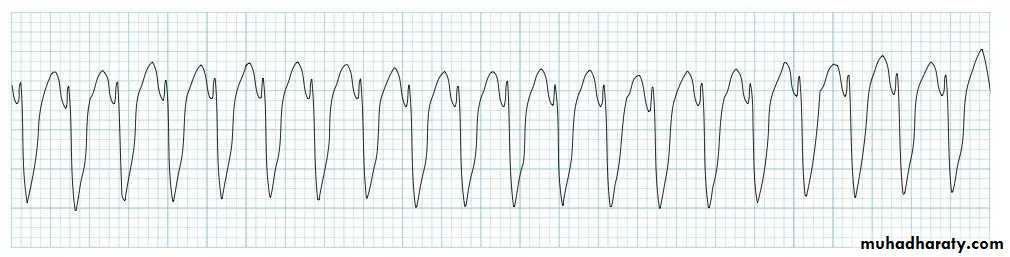
QRS complex
The width of the QRS complex should be less than 0.12 seconds (3 small squares)Wide QRS MAY CAUSED BY
1- VENTRICULAR RHYTHM2- VOLTAGE CRITERIA
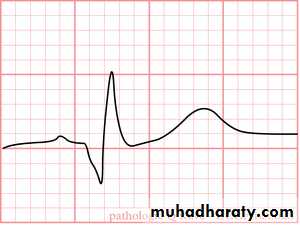
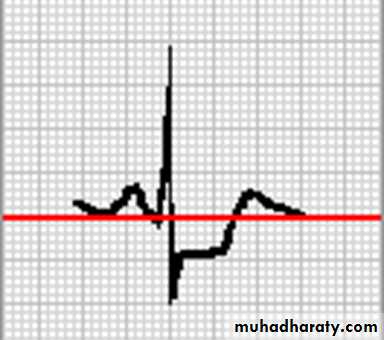
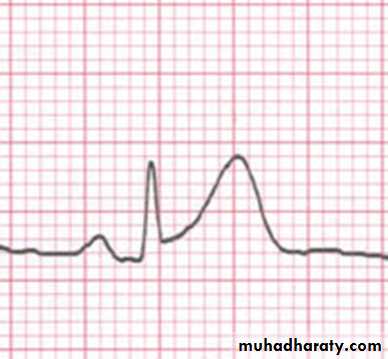
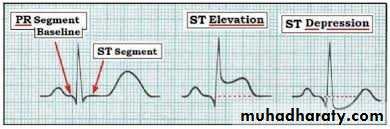
ST segment
1- elevation2- depression
QT INTERVAL
Time interval between beginning ofQRS complex to the end of T wave
The QT interval varies with heart rate
As the heart rate gets faster, the QT interval gets shorter
Normally: At normal HR: QT ≤ 11ss (0.44 sec)Abnormalities:
Prolonged QT interval: hypocalcemia and congenital long QT syndrome.
Short QT interval: hypercalcemia
T wave
Normallyamplitude: < 10mm in the chest leads.
Abnormalities:
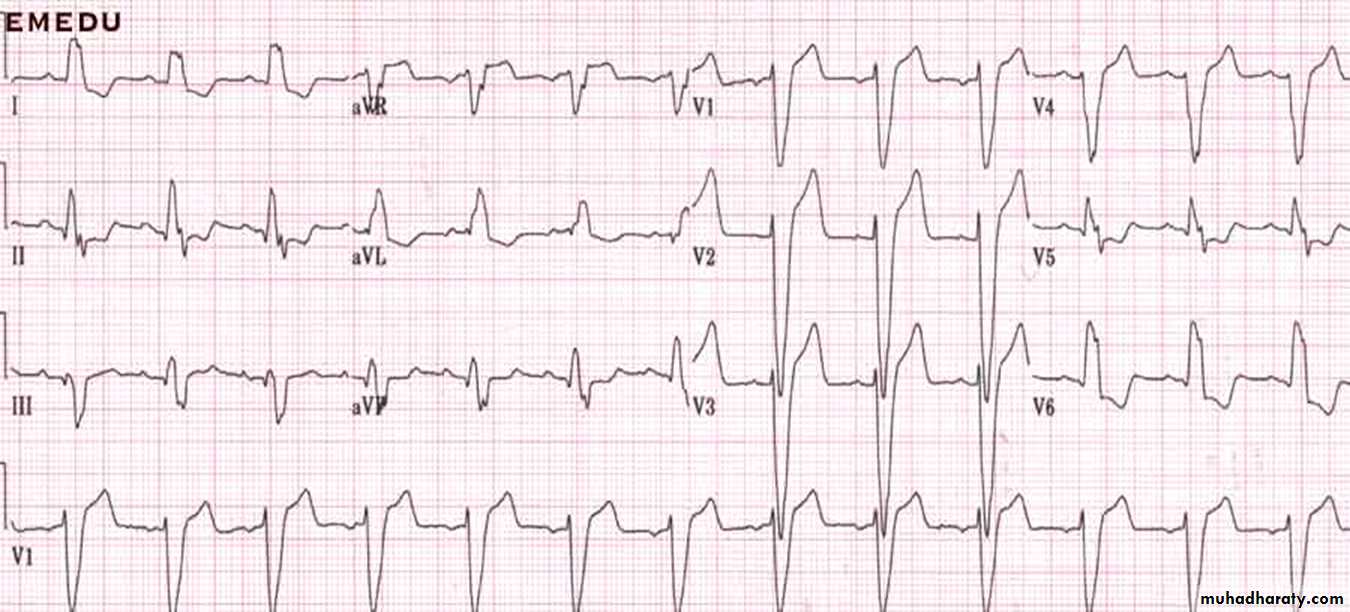
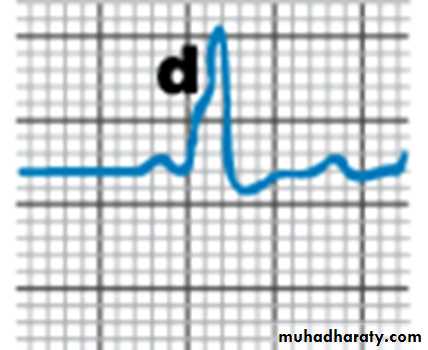
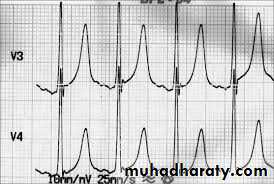
1. Peaked T-wave:
Hyperkalemia. (called tented T)
2. T- inversion:
Ischemia
Voltage and ventricle strain
Rate
If the heart rate isregular
Count the number of large squares between
R waves
i.e. the RR interval in large squares
RATE = 300\ RR
e.g. RR =4 LS
300/4
Rate = 75 beats per minute
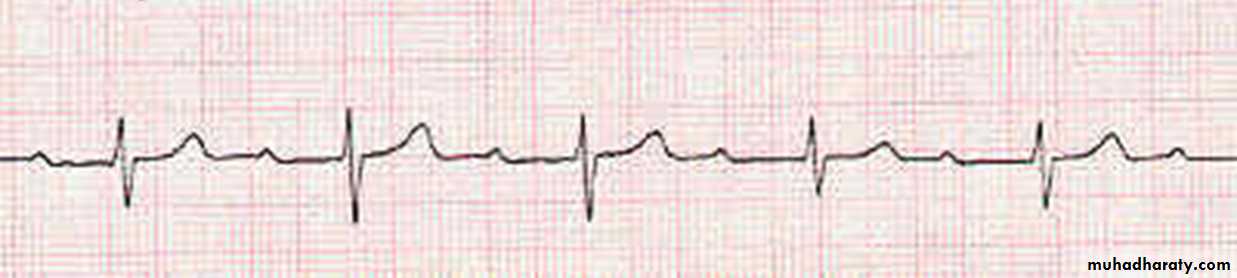
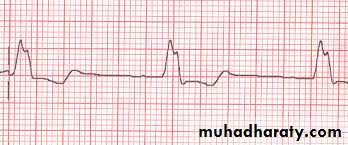
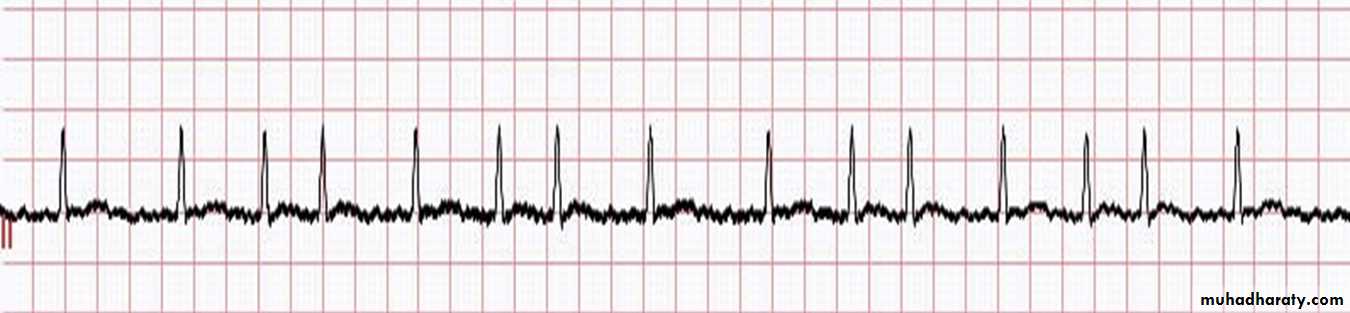
If the rhythm is irregular ;
it may be better to estimate the rate using therhythm strip at the bottom of the ECG (usually lead II)
The rhythm strip is usually timed for 10 seconds.
If you count the number of R waves on that strip
and multiple by 6 you will get the rate
Eg; calculate the rate for this ECG strip
Rhythm
Normal rhythm is called sinus rhythm which is determined by equal RR interval in the entire ECG strip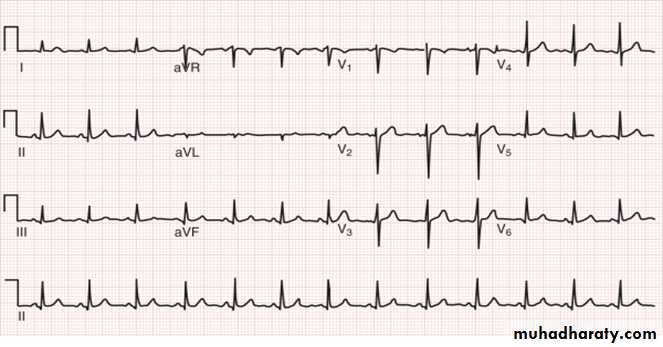
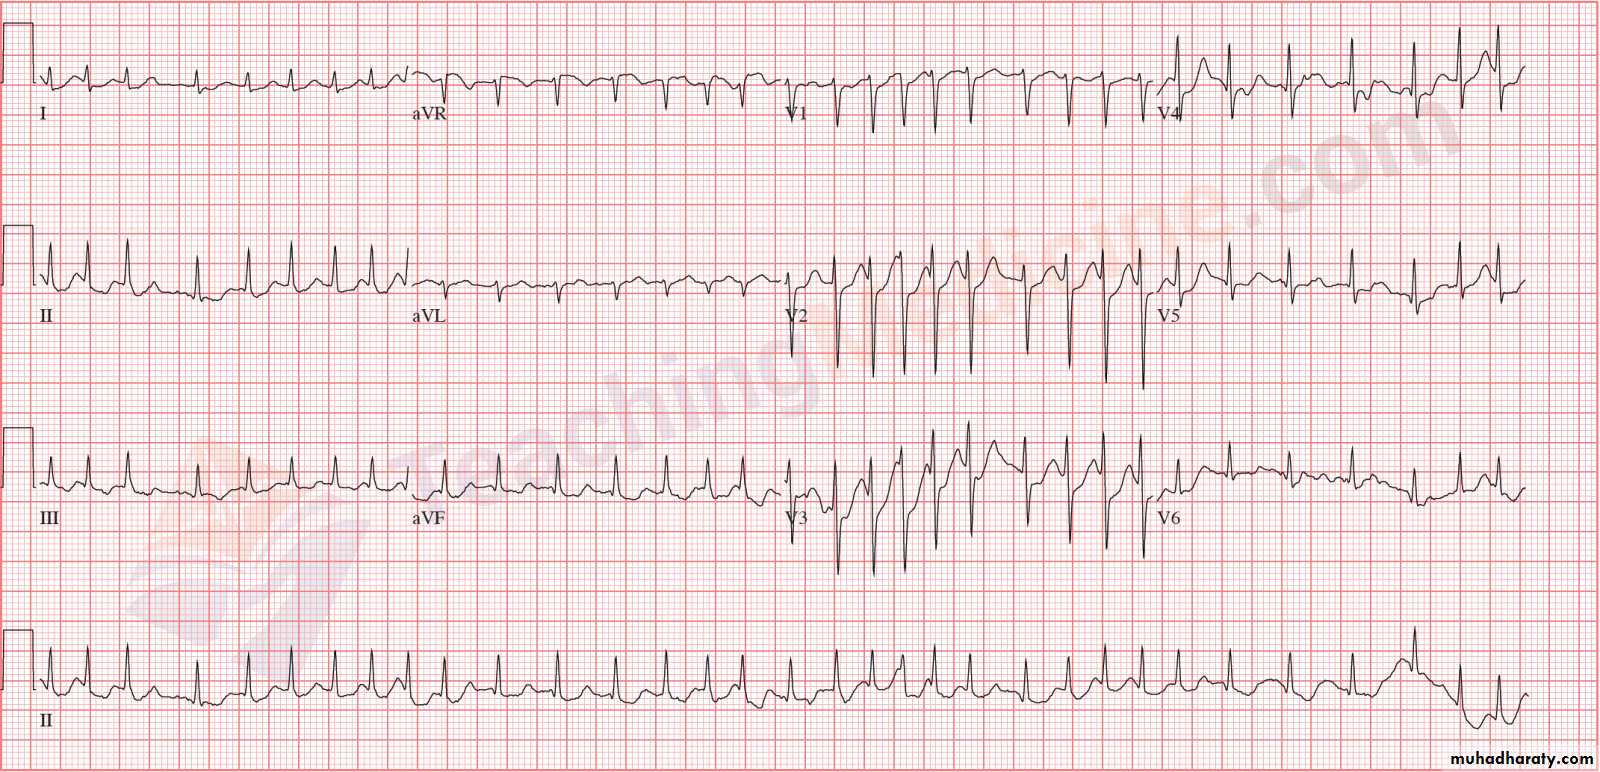
IRREGULAR RHYTHM is encountered in case during which the cardiac impulses is not governed by the SA node eg atrial fibrillation AF
Cardiac axis
The mean frontal axis is the sum of all the ventricular depolarization forces. The average direction of the flow of current is called the electrical axis of the heart (the mean QRS axis) lies between –30° and +100°, This is generally calculated from leads I and III.There is right axis deviation when the QRS waves in these leads point towards each other, while left axis deviation is when they point in opposite direction. If QRS complex is primarily positive in these two leads, the axis is normal.
• LAD: LVH, LBBB, MI
• RAD: Normal, RVH, Dextrocardia