
Practical X2 test
Dr. Muslim
May 10
th
, 2017

Chi-Square Test
Non-Parametric Test
2
- Test

Objectives of the Lecture
At the end of the lecture student will be able to:
Identify the pre-request in performing
χ
2
- test.
Practice the use of
χ
2
– Test in different conditions.

Contingency Tables
Test of Independence of
Two Variables
Chi-Square Test
Test
χ
2

Non-Parametric Test
Chi-Square Test
Is a Greek letter
Chi
, pronounced
χ
2
Kye square,
devised by Karl Person in 1990.
Chi-Square test can be used in testing hypothesis in
wide variety of situation that involve
(Numeration
Data)
i.e
A contingency table is used for:
(Discrete
quantitative)
variables
or
for
(Continuous
quantitative)
variables whose values have been
grouped.
Test
χ
2
A
χ
2
test is used to test whether there is an
association between the row variable and the column
variable
( independence of 2 variables ).
or,
in other word, whether the distribution of individuals
among the categories of one variable is independent
of their distribution among the categories of the other.
or,
to test whether the observed frequencies of individuals
with given characteristic are significantly different to
those expected on some specific hypothesis).
Column
total
R
i
Columns
Rows
c
j
….
c
2
c
1
R
1
O
1j
….
O
12
O
11
r
1
R
2
O
2j
….
O
22
O
21
r
2
.
.
.
.
.
.
.
.
.
.
.
.
.
.
.
.
.
.
.
R
i
O
ij
….
O
i2
O
i1
r
i
T
C
j
….
C
2
C
1
Row total
C
j
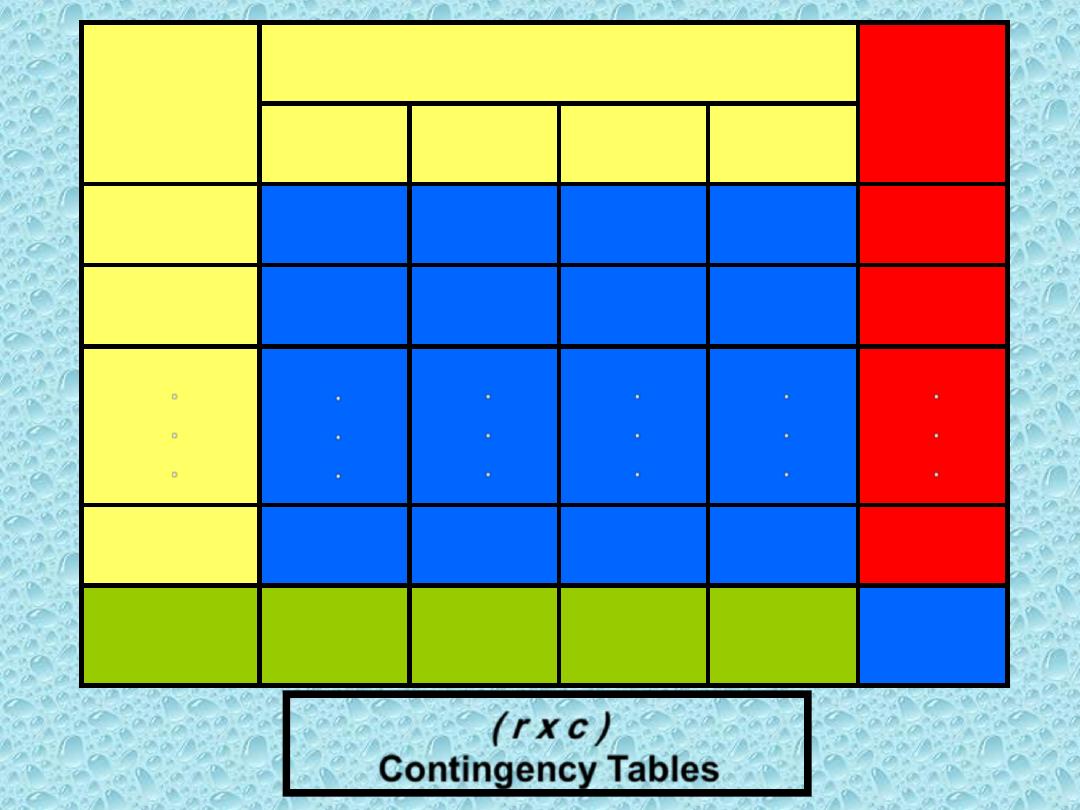
( r x c )
Contingency Tables
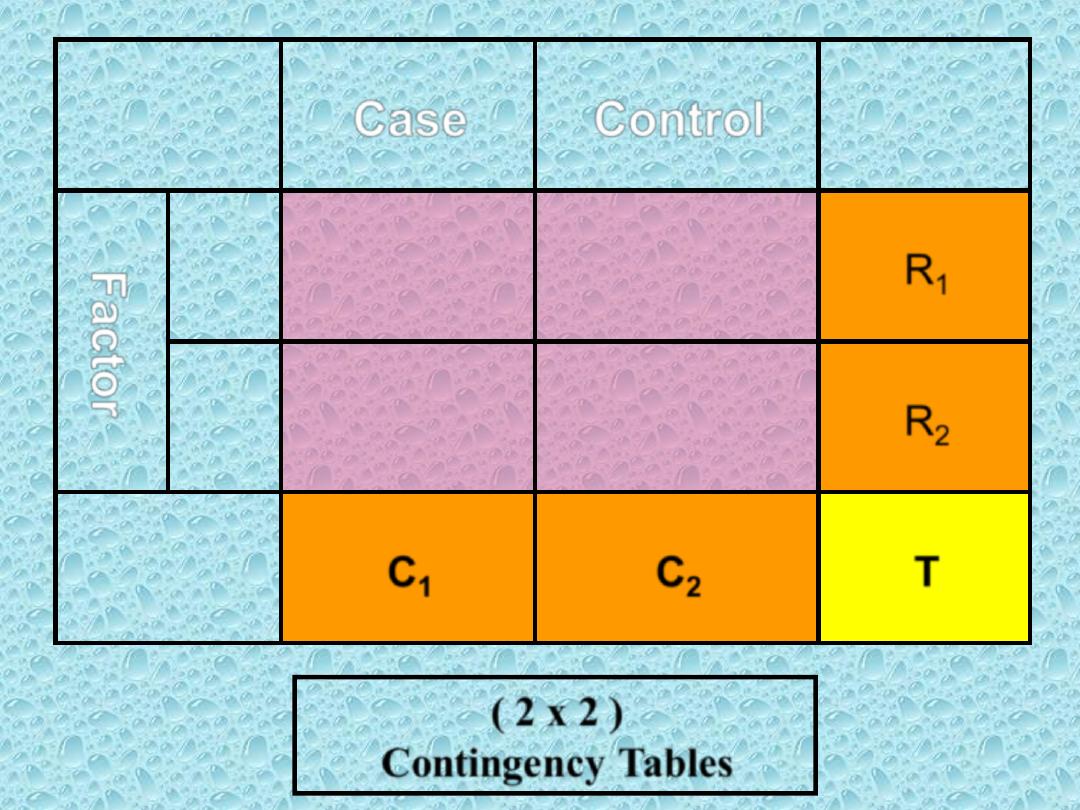
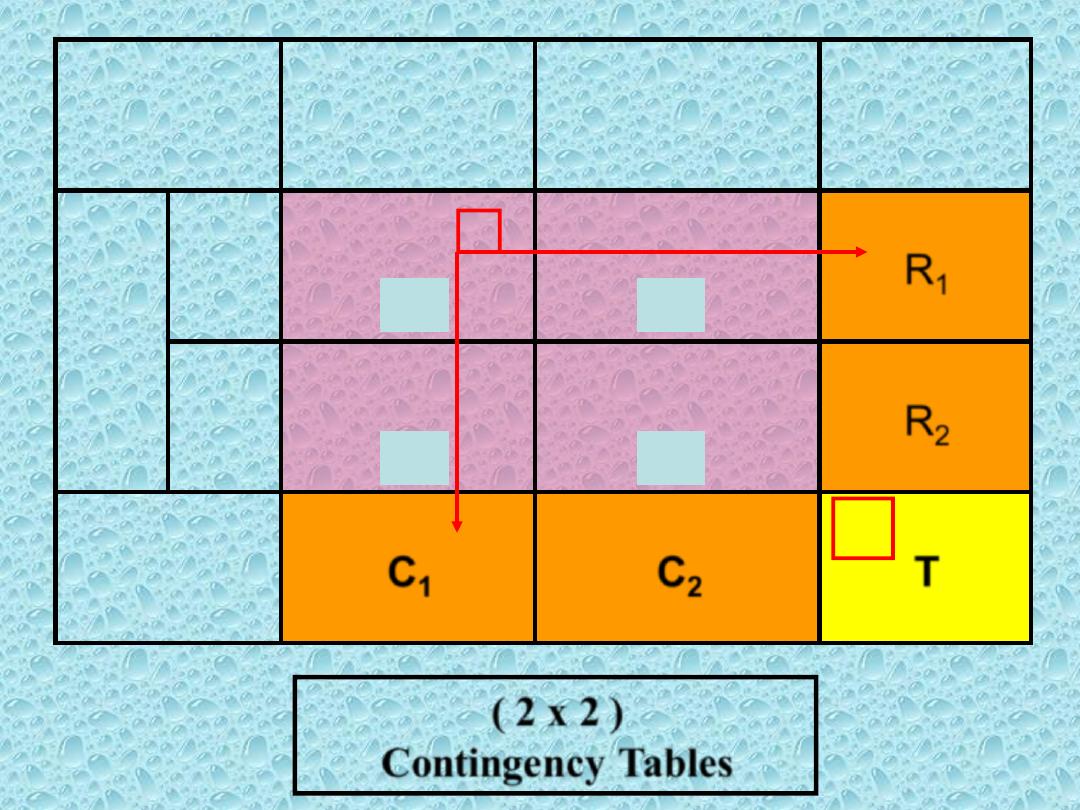
Case
Control
Total
R
i
Fact
or
+ve
O
11
O
12
R
1
-ve
O
21
O
22
R
2
Total
C
j
C
1
C
2
T
( 2 x 2 )
Contingency Tables
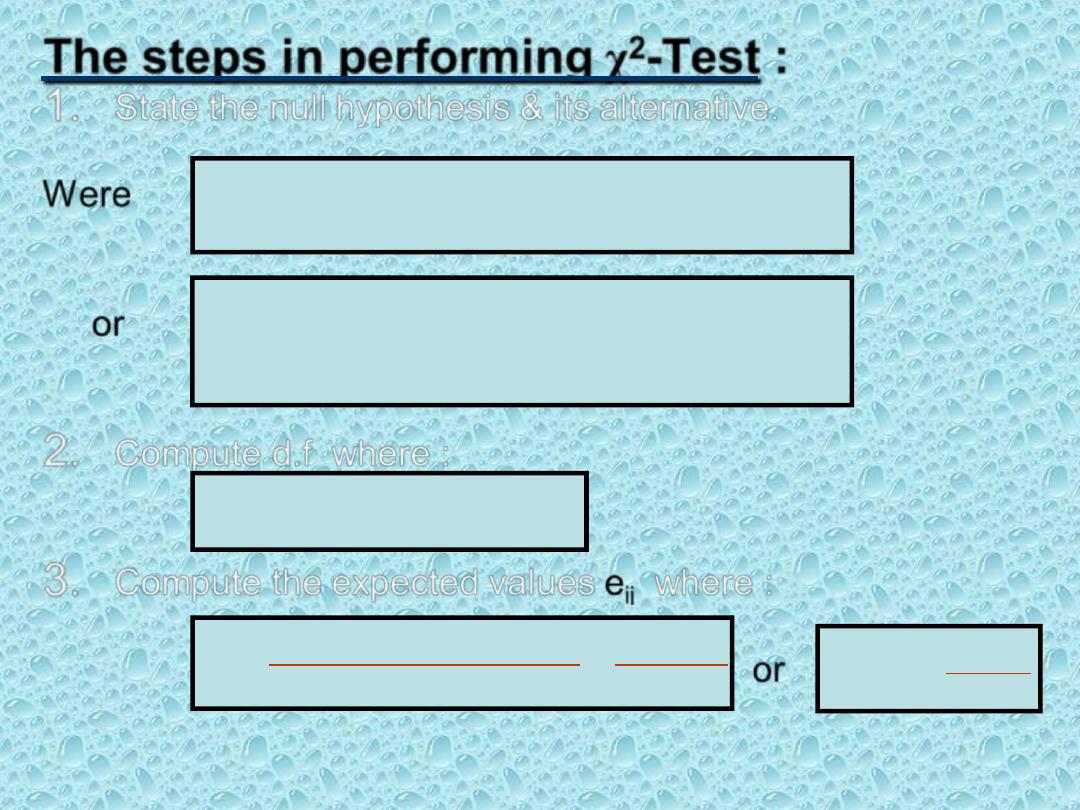
The steps in performing
χ
2
-Test :
1.
State the null hypothesis & its alternative.
Were
or
2.
Compute d.f where :
3.
Compute the expected values
e
ij
where :
or
T
C
R
ij
j
i
e
T
C
R
total
grand
total
column
total
row
E
j
i
ij
)
)(
(
Ʋ = d.f = (r-1)(c-1)
H
0
:
R variable independent from C variable
H
1
:
R variable associated to C variable
Ho :
----------------------------
H1 :
----------------------------
Case
Control
Total
R
i
Fact
or
+ve
O
11
O
12
R
1
-ve
O
21
O
22
R
2
Total
C
j
C
1
C
2
T
e
11
e
21
e
22
e
12
x
( 2 x 2 )
Contingency Tables
Where: O
ij
observed values of each cell
E
ij
expected values of each cell
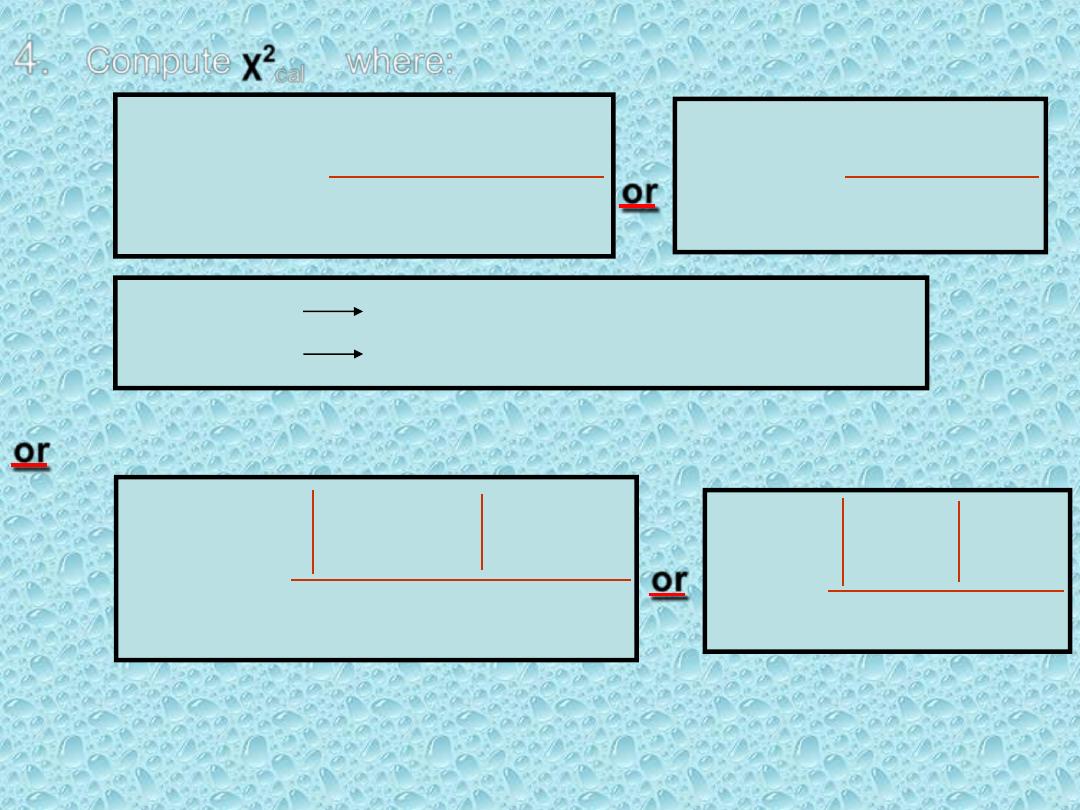
4.
Compute
χ
2
cal
where:
or
or
or
ij
ij
ij
ij
E
E
O
2
2
)
(
ij
ij
ij
ij
e
e
o
2
2
)
(
Uncorr.
Uncorr.
ij
ij
ij
ij
E
E
O
2
2
)
5
.
0
(
corr.
ij
ij
e
ij
e
ij
o
2
2
)
5
.
0
(
corr.
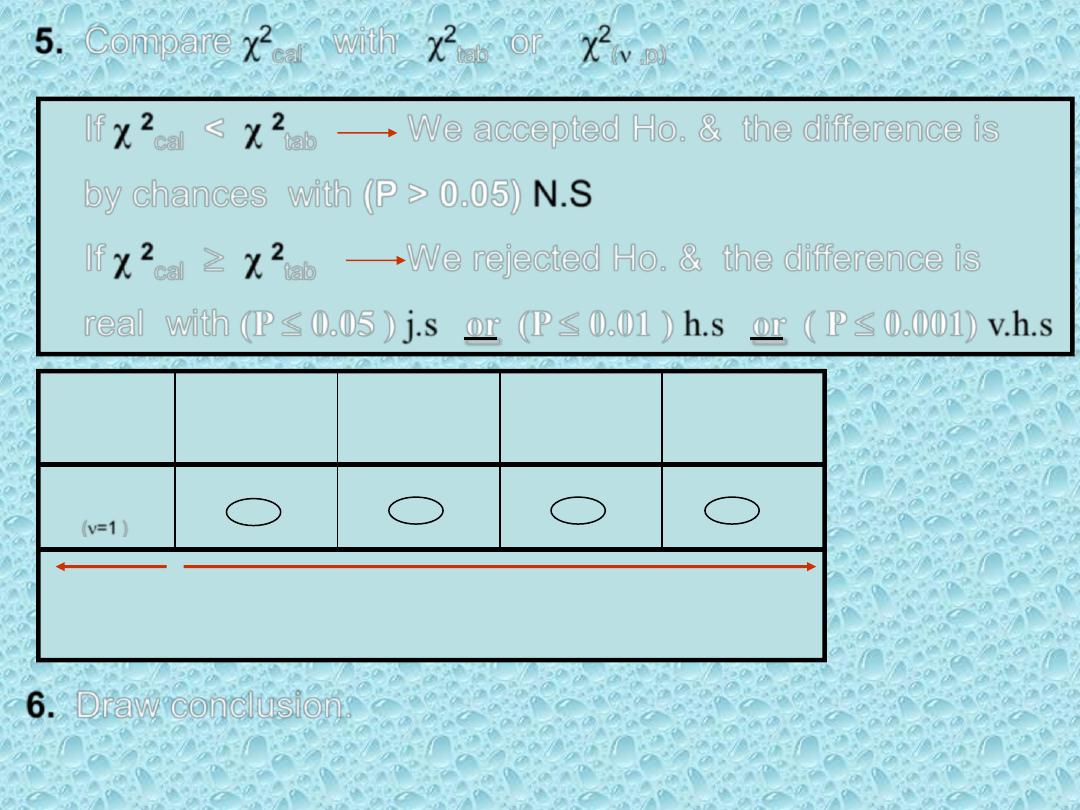
X
2
(
=1
)
6.
Draw conclusion.
N.S
Accepted H
0
Sig.
Rejected H
0
p 0.05 0.02 0.01 0.001
If
χ
2
cal
<
χ
2
tab
We accepted Ho. & the difference is
by chances with (P > 0.05)
N.S
If
χ
2
cal
χ
2
tab
We rejected Ho. & the difference is
real with (P 0.05 )
j.s
or (P 0.01 )
h.s
or ( P 0.001)
v.h.s
5.
Compare
χ
2
cal
with
χ
2
tab
or
χ
2
(
,p)
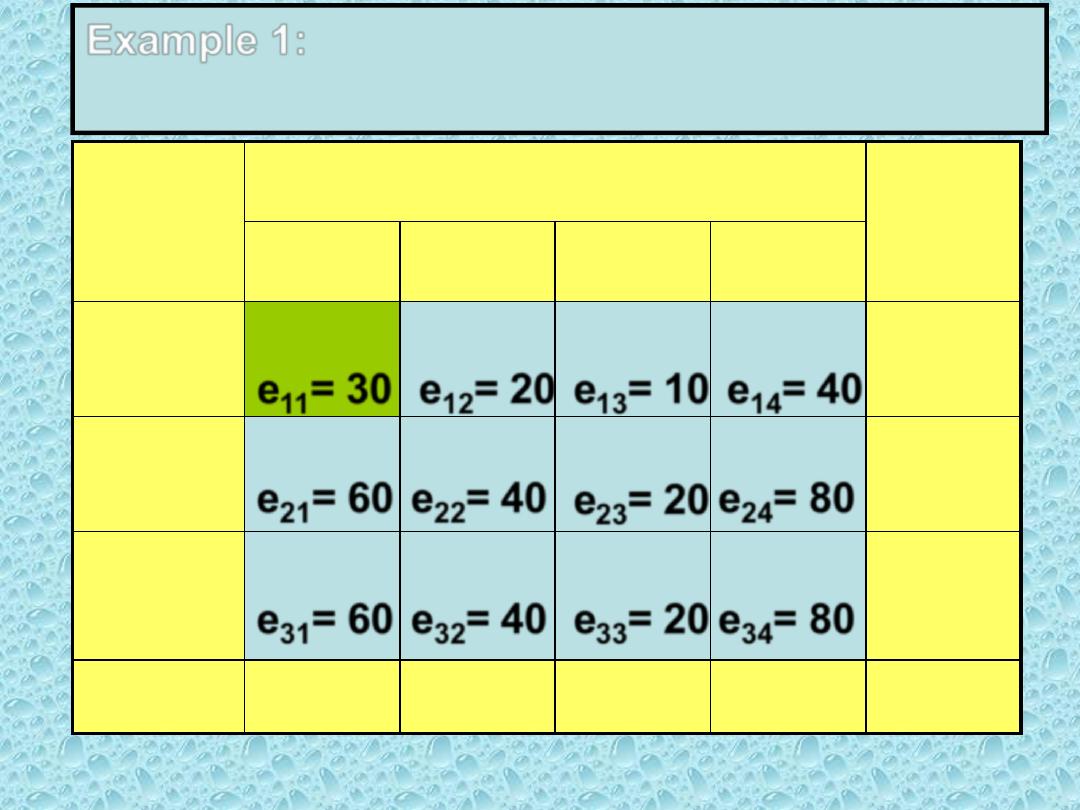
Example 1: Test whether the age of the car
drivers affect on number of accidents.
Column
total
Age of the drivers
No. of
accidents
20 - 30
31- 40
41- 50
51- 60
100
o
14=
34
o
13=
14
o
12=
16
o
11=
36
0
200
o
24=
82
o
23=
20
o
22=
34
o
21=
64
1
200
o
34=
84
o
33=
16
o
32=
50
o
31=
50
2
500
200
50
100
150
Row total
e
21
= 60
e
12
= 20 e
13
= 10 e
14
= 40
e
22
= 40 e
23
= 20 e
24
= 80
e
11
= 30
e
31
= 60 e
32
= 40 e
33
= 20 e
34
= 80

Ʋ =
(r -1)(c -1) = (3 -1)(4 -1) = 6
H0:
Age of drivers is independent from no. of car accidents
H1: There is an association between the two.
30
500
150
100
)
)(
(
11
T
C
R
E
j
i
ij
ij
ij
ij
E
E
O
2
2
)
(
88
.
10
80
)
80
84
(
30
)
30
36
(
2
2
2

Since
ϰ
2
Cal.
(10.88) <
ϰ
2
Tab
(12.59
) → Accept H0.
Conclusion: The age of the drivers is not affect on no. of
accidents.
ϰ
2
Tab (6,0.05)
=
12.59

Example 2: Test whether the vaccine was effective or
whether the difference could arisen by chance?
Placebo
Vaccine
100
80
20
Yes
Influenza
360
140
220
No
460
220
240
Solution:
Ʋ =
(r-1)(c-1) = 1
ϰ
2
Tab (1, 0.05)
= 3.84
E=52.2
E=47.8
E=187.8
E=172.2
2
.
172
2
)
2
.
172
140
(
8
.
187
2
)
8
.
187
220
(
8
.
47
2
)
8
.
47
80
(
2
.
52
2
)
2
.
52
20
(
2
09
.
53
02
.
6
52
.
5
69
.
21
86
.
19
2

Placebo
Vaccine
100
80
20
Yes
Influenza
360
140
220
No
460
220
240
Conclusion:
ϰ
2
Cal
(53.09) >
ϰ
2
Tab
(3.84
) →
Reject H
0
i.e. the vaccine is effective.
E=52.2
E=47.8
E=187.8
E=172.2
)
5
.
0
(
2
2
E
E
O
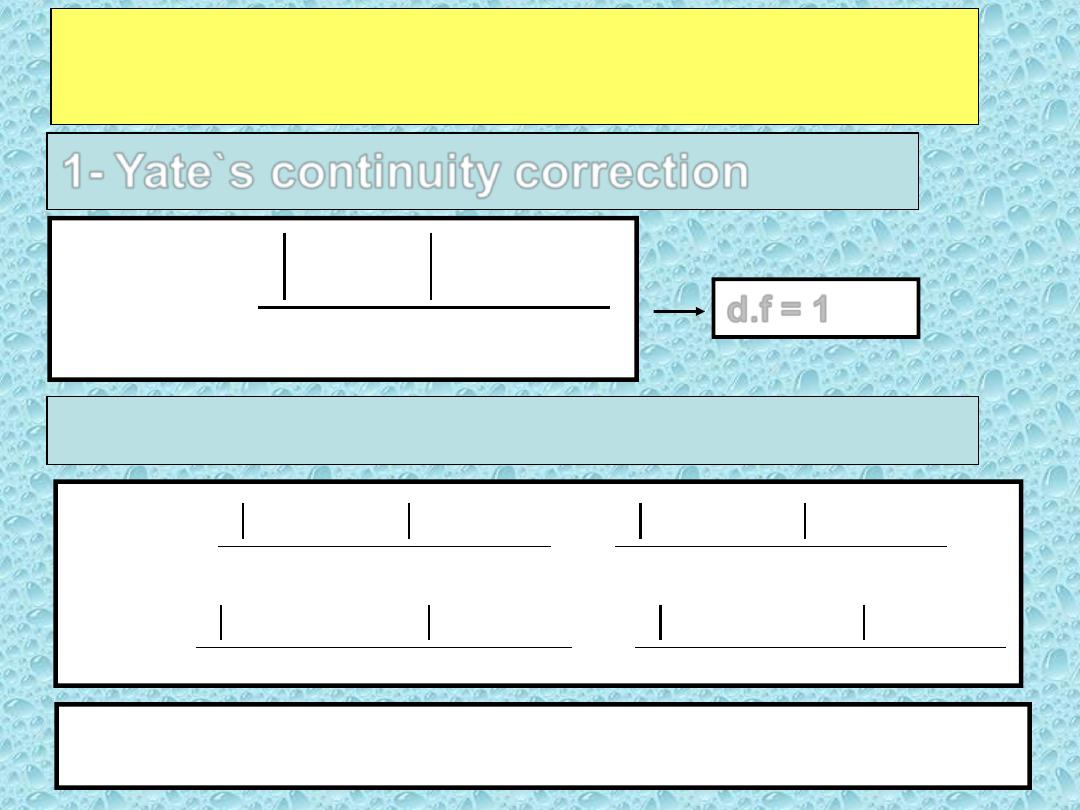
Rules for 2
2 table only:
Resulting in a smaller value for
ϰ
2
1- Yate`s continuity correction
2
.
172
2
)
5
.
0
2
.
172
140
(
8
.
187
2
)
5
.
0
8
.
187
220
(
8
.
47
2
)
5
.
0
8
.
47
80
(
2
.
52
2
)
5
.
0
2
.
52
20
(
2
46
.
51
84
.
5
35
.
5
02
.
21
25
.
19
2
d.f = 1

Rules for 2
2 table only:
2- Quick formula
(no need to calculate Expected
values)
1
d.f
)
(
2
2
h
g
f
e
T
bc
ad
e
b
a
f
d
c
T
h
g
100
80
20
360
140
220
460
220
240
53.01
20
2
40
2
60
3
00
1
460
)
220
80
140
20
(
2
2

Rules for 2
2 table only:
Continuity correction for quick formula
1
d.f
2
2
2
h
g
f
e
T
T
bc
ad
1
d.f
)
(
2
2
efgh
T
bc
ad
100
80
20
360
140
220
460
220
240
51.37
000
800
900
1
460
)
2
460
14800
(
20
2
40
2
60
3
00
1
460
)
2
460
220
80
140
20
(
2
2
2