COHORT STUDIES
بسم الله الرحمن الرحيم
1
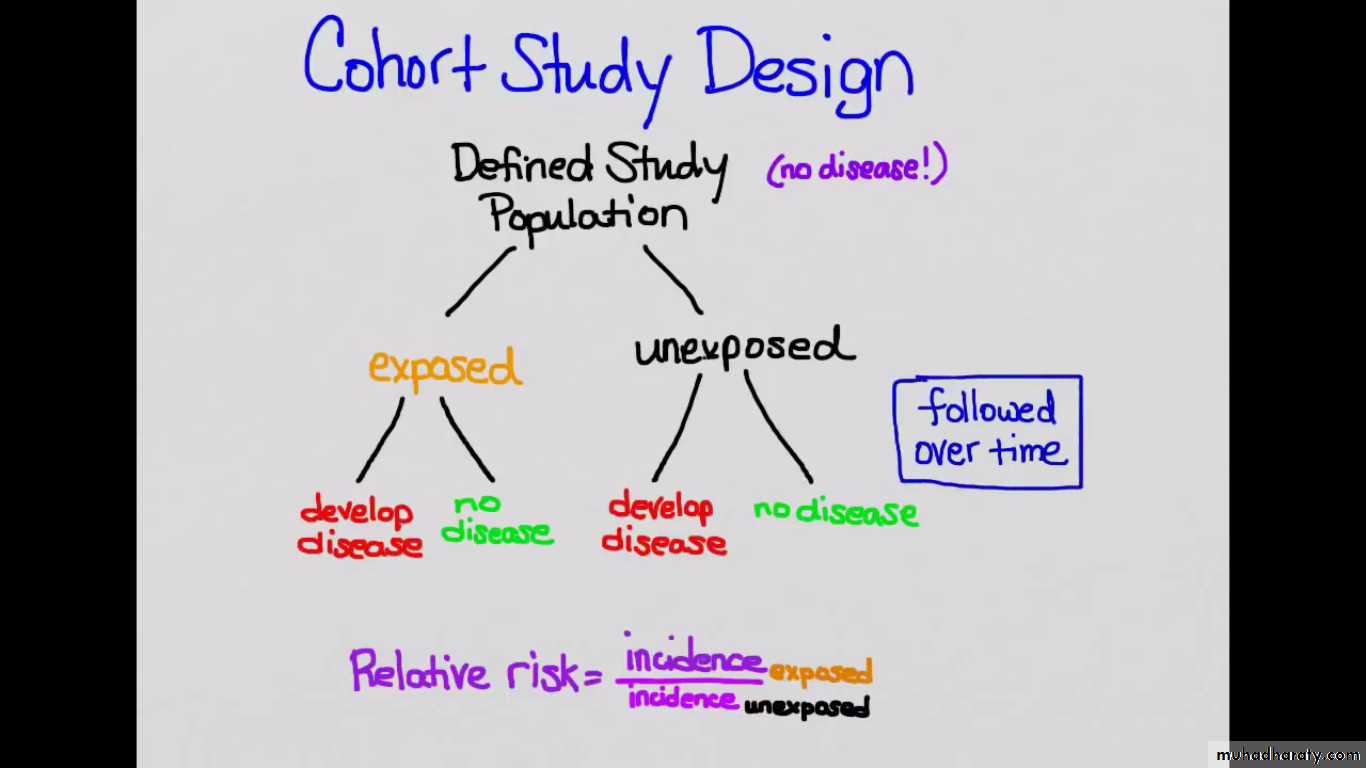
Cohort (follow-up) studies are observational analytic studies, where
group (s) of individuals are defined on the basis of presence or absence ofthe exposure to a suspected risk factor of a disease, then followed for
a period of time to assess the occurrence of the disease provided thatthey should be FREE from the disease at the start of the exposure .
Two main types:1.Follow-up studies (the prospective form)
2.Retrospective cohort study :
2
• Follow-up studies (the prospective form)
Constitutes the basic observational strategy for testing hypotheses.In a follow-up study, people without the disease are followed up
to see who develop it, and disease incidence in persons with
a characteristic is compared with incidence in persons withoutthe characteristic.
A "cohort" is a defined group of people who sharea common characteristic. e.g. born in certain year, have same
exposure to a hazard.3
4
Exposed to a risk factor
Developed an outcomeDidn’t develop an outcome
Not Exposed to a risk factor
Developed an outcomeDidn’t develop an outcome
Present FutureDiagram of Prospective Cohort Studies
5
Exposed to a risk factor
Developed an outcomeDidn’t develop an outcome
Not Exposed to a risk factor
Developed an outcomeDidn’t develop an outcome
2. Retrospective cohort study :The observer looks backward to the disease & exposure because both of them have happened when the study had started"
past investigator
Diagram of Retrospective Cohort Studies6
• Total
• Disease
• Absent
• Present• a+b
• Exposed• b
• a
• (+)ve
• Exposure to a risk factor
• c+d
• Non Exposed
• d
• c
• (-)ve
• a+b+c+d
• b+d• (controls )
• a+c
• (cases)
• Total
The two by two table :
We start with 2 groups , one exposed to the factors & the other group not
exposed but both groups do not have the disease , then follow them up in time.Group 1 Exposed : ( a+b )
Group 2 Non Exposed : ( c+d )7
Analysis :
The measure of association between the exposure & the development of the disease is calculated by :Incidence of disease among exposed
1. Relative risk (RR) = ـــــــــــــــــــــــــــــــــــــــــــــــــــــــــــــــــــــــــــــــــــــــــــــــــــــــــــــــــ no unitIncidence of disease among non exposed
a / ( a+b)
Relative risk (RR) = ــــــــــــــــــــــــــــــــــــc / (c+d)
RR = 1 : No association bet exp. & risk of disease
RR > 1 : +ve association ( increased risk among exposed) ( risk factor).
RR< 1 : -ve association ( decreased risk among exposed) ( protective factor).
. RR estimates the magnitude (strength ) of association between exposure & disease.
. it indicates the probability of developing the disease in the exposed related to those unexposedThe exposure : risk factor The outcome : disease or death
8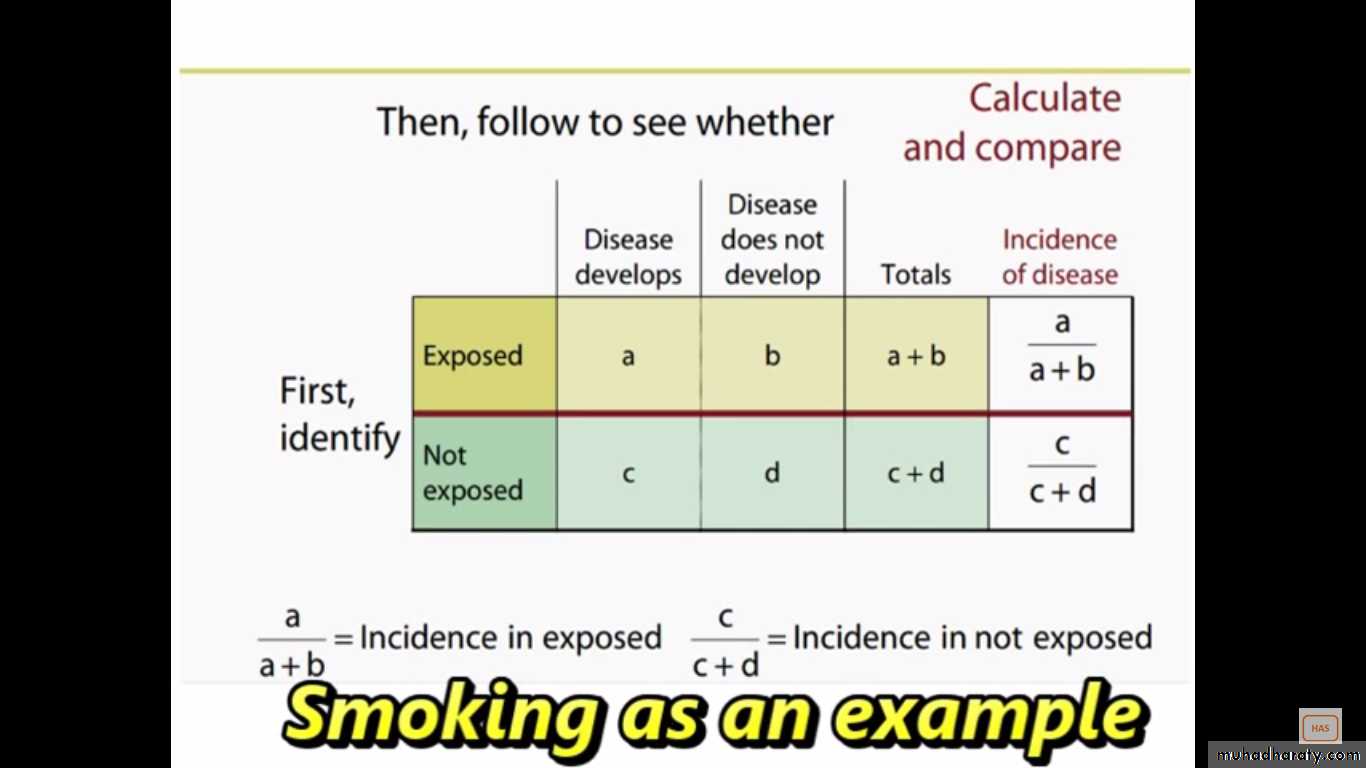
9
e.g. 1
In a Cohort study for association between usage of oral contraceptive use (OCP) & bacteruria, the following table was formed:• Total
• Bacteruria
• No
• Yes• 482
• 455• 27
• Yes
• OCP
• 1908
• 1831
• 77
• No
• 2390
• 2286• 104
• Total
a / ( a+b) 27/482
1- Relative risk (RR) = ــــــــــــــــــــــــــــ = ـــــــــــــــــــــ = 1.4
c / (c+d) 77/1908
This means that those who are OCP users have risk a 1.4 times the risk to develop the outcome than those no exposed.
10
e.g.2 suppose the incidence of Hepatitis B sero (+)ve among those having
previous blood transfusion is 5/1000 / year & those with no blood transfusionis 1/1000/y so:
5/1000/yearRR= ـــــــــــــــــــــــــــــــــــ = 5 times of developing an outcome among exposed
1/1000/year compared to the non- exposed )
11
2. Attributable Risk (AR) :
AR= I exposed minus I non exposed
AR = {a / ( a+b)} - {c / (c+d)} ……. unit
Also called the risk difference .provides information about the absolute effect of the exposure
i.e. the excess risk of dis. among the exposed compared to thenon exposed . Now look at the bacteruria –OC table
AR = Ie - Ie‾ = 56.02/1000 per year - 40.36/1000 per year=15.66/1000 per year
Note :
"AR is only calculated from cohort studies " & cannot be
calculated from case-control studies .12
Back to hepatitis example so :
AR = 5/1000 hepatitis per year -1/1000 hepatitis per year
= 4/1000 hepatitis per year ( absolute measure , effect of the exposure).. It quantifies the excess of risk of disease in the exposed group which
is attributable to the exposure.. AR is useful as a measure of public health impact of a particular
exposure assuming a causal effect f the exposure on the outcome .13
140
RR ( lung Ca) = ـــــــــــــــــ = 14 times10
669
RR ( CHD) = ـــــــــــــــــ = 1.6 times
413
So 14.0 : A person who smokes will have a 14.0 times chance to die from lung
Ca than a non- smoker . And :
1.6 : 1.6 times chance to die from CHD than a non- smoker
Annual Mortality Rate per 100,000• CHD ( coronary H. disease)
• Lung Ca
• 669
• 140
• Cig. Smokers
• 413
• 10
• Non-smokers
• 1.6
• 14.0
• RR
• 256/105/y
• 130/105/y
• AR
14
3. Attributable Risk Percent (AR%) :
Attributable Risk
Attributable Risk % = ـــــــــــــــــــــــــــــــــــــــــــــــــــــــــــــــــــ x 100
Incidence among exposed
Estimates % of gain, if the factor is removed from population.
Gives an idea about the proportion of the disease in the exposed that could be prevented by eliminating the exposure .e.g. of cohort the bacteruria –OC
15.66/1000/year
AR% = ــــــــــــــــــــــــــــــــــــــــــــــــ x 100 = 27.95%
56.02/1000/year
It estimates the proportion of the disease among the exposed that is attributed to the exposure.
15
Incidence
I among I among nonexposed exposed
A R%
A R
16Strengths -Advantages-of cohort studies:
1. Establish the temporal relationship between disease. i.e. the timesequence between the exposure & the outcome & it is important in
determining the causal outcome .2. determines the risk of getting the disease through the exposure to
a factor.3. Useful for rare exposure. E.g. : Chemical & Radio active exposure is best
studied through Cohort.4. Examines multiple effects of a single exposure. E.g. People exposed to
Asbestos & follow them up to develop Lung Ca, pulmonary fibrosis & other
effects of the exposure5. Allows direct measurement of the incidence of the disease among
exposed & non- exposed groups.17
2. Time Consuming : due to the follow up e.g. Framingham Study
which started in the 50s studying the exposure of certain factors todevelopment of various heart disease.
3. Problems to follow up : die, run away, disappear ,.etc.4. Of limited use in rare disease.
18
Sources of Exposure Data
1. Pre-existing records.2. Information from the study subjects -interview.
3. Direct Physical examination or an investigation.
4. Direct measurement of the environment.
e.g. detection of the exact level of a certain thing in the environment as noise by a sound level meter.
Selection of Comparison Group
They should be similar to the study group in all the factors related to the disease, except the factor under study.Sources of Outcome Data
Fatal Outcome : - death certificates.Non-Fatal Outcome :
- Medical Records.
- Direct from the participants.
- Data from periodic M Exam.
The method of assessment of outcome should be the same for both groups.
19
e.g. "A" a hypothetical cohort study of cigarette Smoking & lung Ca (100exposed, 100nonexposed)
• Total
• lung Ca• Control
• Case• 100
• 30• 70
• Yes
• Cigarette Smoking
• 100
• 70
• 30
• No
• 200
• 100
• 100
• Total
a / (a+b) 70 / 100
RR = = = 2.3c/ (c+d ) 30 / 100
20
Now : same e.g. "B“370 exposed 730 non exposed
• Total• lung Ca
• Control
• Case• 370
• 300• 70
• Yes
• Cigarette Smoking
• 730
• 700
• 30
• No
• 1100
• 1000
• 100
• Total
a / (a+b) 23 x 2816
RR = = = 4.6 changedc/ (c+d ) 304 x 133
21